It’s that time again – the deadline for the next big conference in your field is fast approaching, and you are staring down a blank page. Where to start? How to make your abstract stand out and get noticed?
I recently had the opportunity to review conference abstracts for a major conference in our field. After reading over 50 abstracts for our session, the differences between outstanding abstracts and forgettable or insignificant ones became pretty clear. As I tried to articulate these thoughts for myself to evaluate the abstracts more consistently, I thought I should write it down for the benefit of the students that I supervise. I haven’t posted anything on here in a long time (sorry!), so then I also thought I would share it with the wider world in case it would be interesting for more of you.
Here are the most important things that I look for when evaluating conference abstracts:
Big news to start 2023: I am now an Assistant Professor in Coastal Engineering here at TU Delft! An opening appeared online last summer, and after weeks of preparing applications, several rounds of interviews and a teaching demonstration, and a lot of waiting, I finally got the good news. This has been my dream job for a long time and I can’t believe it came true.
Officially, my new portfolio will focus on “Climate-Robust Deltas”. How does sediment contribute to the strength and adaptability of our coasts and deltas against the effects of sea level rise and climate change? In my research we approach this gigantic problem by quantifying sediment pathways and connectivity for strategic placement of sediment, using a combination of numerical modelling and field measurements. In the coming years, I hope to build up a diverse team of enthusiastic, coastally curious researchers to tackle these challenges. Stay tuned for opportunities to join our group!
It already seems like an eternity ago – from 2007 until 2012, I studied civil engineering at the University of Waterloo in Ontario, Canada. I was recently contacted by the UW alumni department to reflect on my undergraduate experiences for prospective students. They eventually posted their Q&A online, so I thought I would share it here too, in case anyone reading this blog is contemplating a career in civil engineering or going to UW.
A few weeks ago, I was reading a book about glaciology recently when a sentence caught my eye. Many advances in our understanding of how glaciers developed and transformed our world during the last ice age came from studying the Canadian landscape. In particular:
A benchmark example [of paleo ice sheet reconstruction] was the compilation of the first Glacial Map of Canada in 1959, followed by its update in 1968, by the Geological Survey of Canada, based on painstaking aerial photograph and field mapping by its officers on a map sheet by map sheet basis after the completion of the aerial photograph coverage for the whole country in the 1950s.
This caught my eye, because I knew that my Grandpa on my Dad’s side of the family was a pilot who flew a lot of aerial surveys for the Canadian government in the late 50s. I mentioned this to my Dad, just thinking he’d say, “gee, that’s cool”, and move on. Apparently that triggered something in him though, because a few days later my email inbox was filled with a treasure trove of old family photos that I had never seen before. In recent years I have also developed an interest in Arctic coastal geomorphology, so this discovery scratched a couple of itches for me.
One of the photos was taken above Alexandra Fjord on Ellesmere Island, which is insanely far north (78°N!):
Alexandra Fjord, Ellesmere Island. Photo copyright B.G. Pearson.
The cool thing is that when I went into Google Earth, I was able to snoop around and actually to find the same vantage point. To my surprise, it seems like the glaciers there haven’t changed much since my grandfather was there in 1957:
Alexandra Fjord today, seen in Google Earth.
However, Dad pointed out that perhaps the glacier at the front hasn’t changed, but that the ice field behind it has shrunk. He probably has a point there…
So pristine! Photo copyright B.G. Pearson.
My Grandpa’s airplane on the right hand side. Photo copyright B.G. Pearson.
Why was he actually up there, and what were they surveying? A series of radar transponders were set up across northern Canada so that the airplanes could precisely triangulate their positions . Based out of Ottawa, my Grandpa and his colleagues carried out many long flights between remote destinations A newspaper article from 1957 describes the tremendous undertaking that mapping the entire Canadian Arctic was, apparently the world’s most ambitious aerial survey operation at the time:
“SEVEN-YEAR JOB: Rockcliffe Squadron to Complete Mapping
Monday, March 25, 1957
“Planes from the RCAF’s 408 Photo Squadron at Rockcliffe Airport will fly to within 450 miles of the North Pole this Spring to complete the geodetic survey of Canada which it started seven years ago.”
“Using the huge USAF base at Thule, Greenland, and RCAF’s own base at Resolute Bay, both well within the Arctic Circle, the planes will criss-cross approximately 400,000 square miles of Arctic wasteland to produce reference points for the accurate mapping of Canada.”
“This year’s aerial mapping mileage will bring over 3,000,000 square miles – approximately 90 percent – of Canadian territory accurately surveyed by the Air Force. When the 300 men of the squadron return to base here about July 1, they will have completed the world’s greatest aerial survey operation.”
Survey points in the Canadian Arctic from the 1950s. My Grandpa flew some of the northernmost missions.
While the mapping operation may have been motivated by a Cold War-era push to map Canada’s north for defense purposes, the operation was also of great scientific benefit. In addition to providing a wealth of useful data for glaciologists, the measurements also provided important insights into other fundamental geophysical questions. For instance, the earth is not a sphere, but rather an oblate spheroid, or something like a squashed rugby ball. But even then, gravity is weird and complicated, so the rugby ball comparison only takes you so far, and precise measurements are necessary to figure out all of the actual irregularities in Earth’s shape.
Measurements like these have many applications, including for estimating sea level rise rates. By understanding how the Canadian Arctic is rebounding in response to deglaciation, scientists can better answer Tricky Questions About Sea Level Rise there.
One of my favourite stories from the 1957 article involved some of the corrections that were made to previous maps:
“Throughout the … programme, many positions believed to be accurate were found to be in error. In 1956, for example, Prince of Wales Island (in which the North Magnetic Pole was then located) was found to be three miles further south than was indicated on the map.”
“Although they didn’t possess any supernatural strength to move mountains, from such discoveries as this, the members of the 408 Photographic Squadron did, facetiously, claim the ability to move islands.”
I would thus like to think that all my researchon islands is simply carrying on a Pearson family tradition! My Dad (a civil engineer) also worked in the Arctic during the 1980s, constructing artificial islands in the Beaufort Sea. That’s a story for another time, though!
Speaking of Pearson family traditions, I can see that my Grandpa also had a clear eye for photographic composition, a gift that my Dad quite strongly inherited:
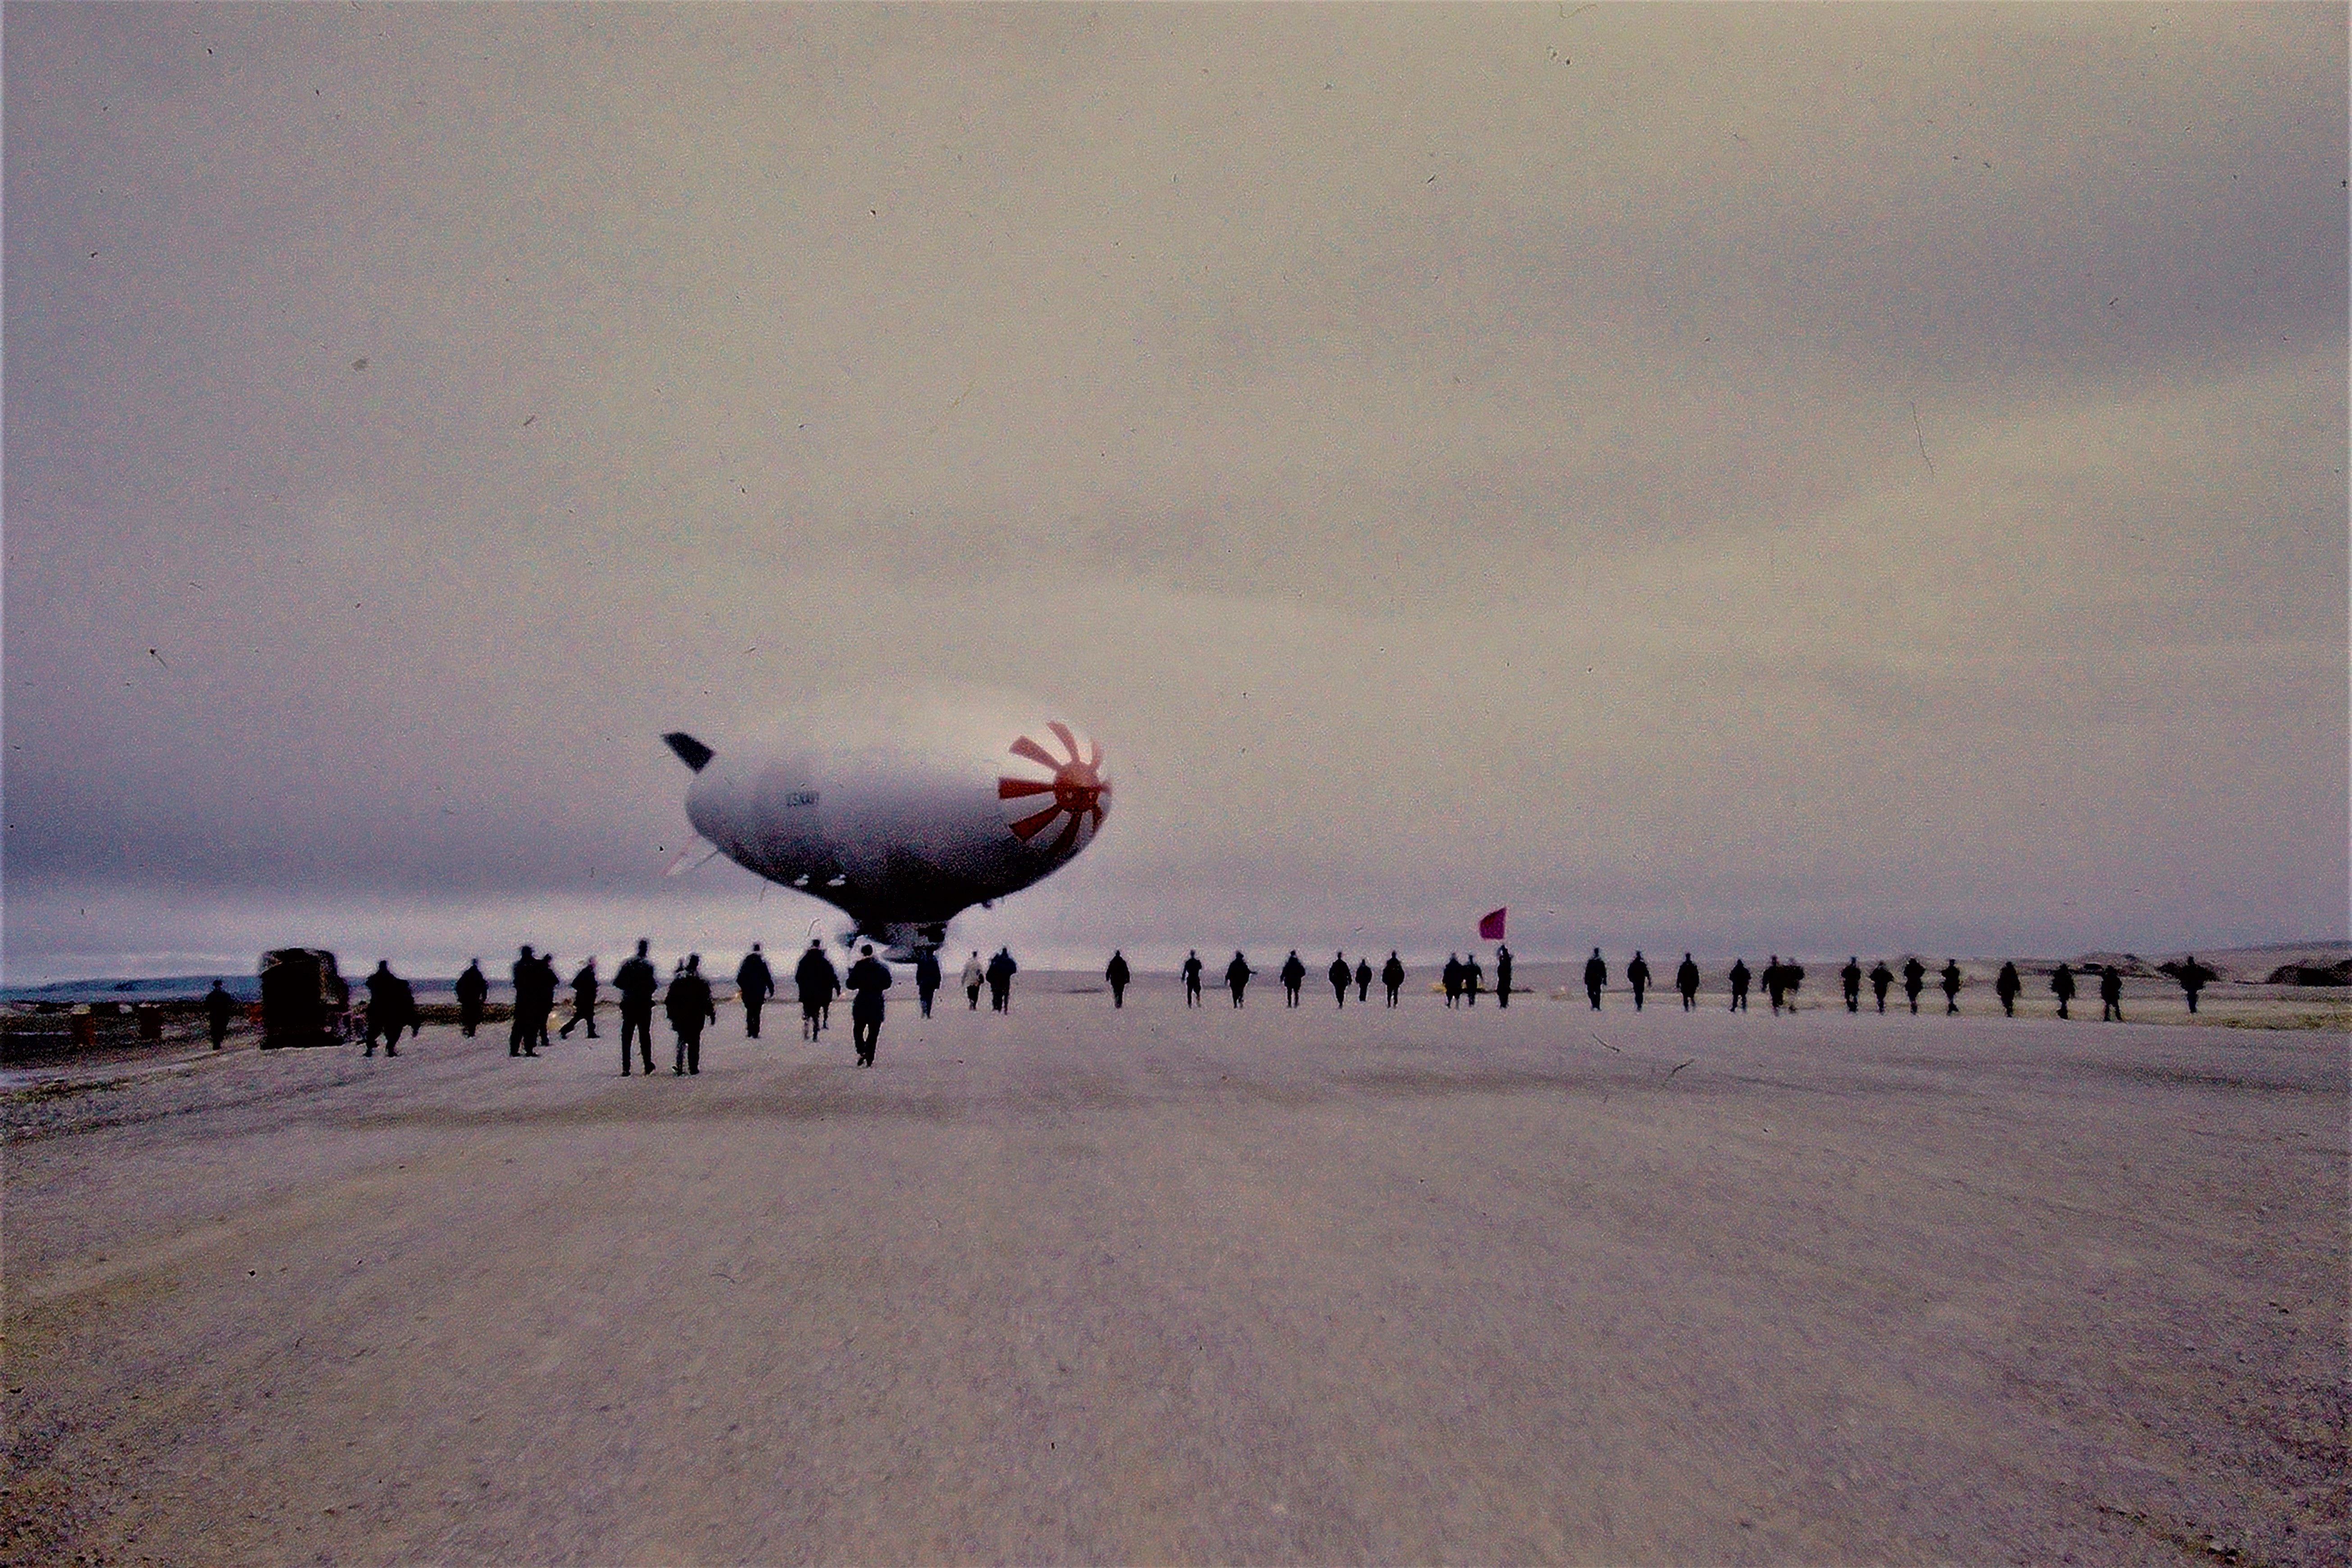
Airship on some remote runway in the far Canadian north. Photo copyright B.G. Pearson.
Another reasons I was so delighted by these photos is because one of my favourite painters, Lawren Harris, also spent a lot of time in the Canadian Arctic. I have always felt drawn to his dramatic mountain landscapes capped with snow, and nary a tree for thousands of miles. The mountains of the far north have a particular shape to them, which seems unique compared to most of the mountains I have seen with my own eyes.
Mount Thule, Bylot Island, by Lawren Harris, one of my favourite painters. He had a very unique view of the same Arctic landscapes my Grandpa used to fly over.
I made it as far north as Lofoten in Norway (68°N), and have flown over parts of the Arctic on transatlantic summer flights, but have never actually set foot on those rugged and remote hills. Something for my bucket list!
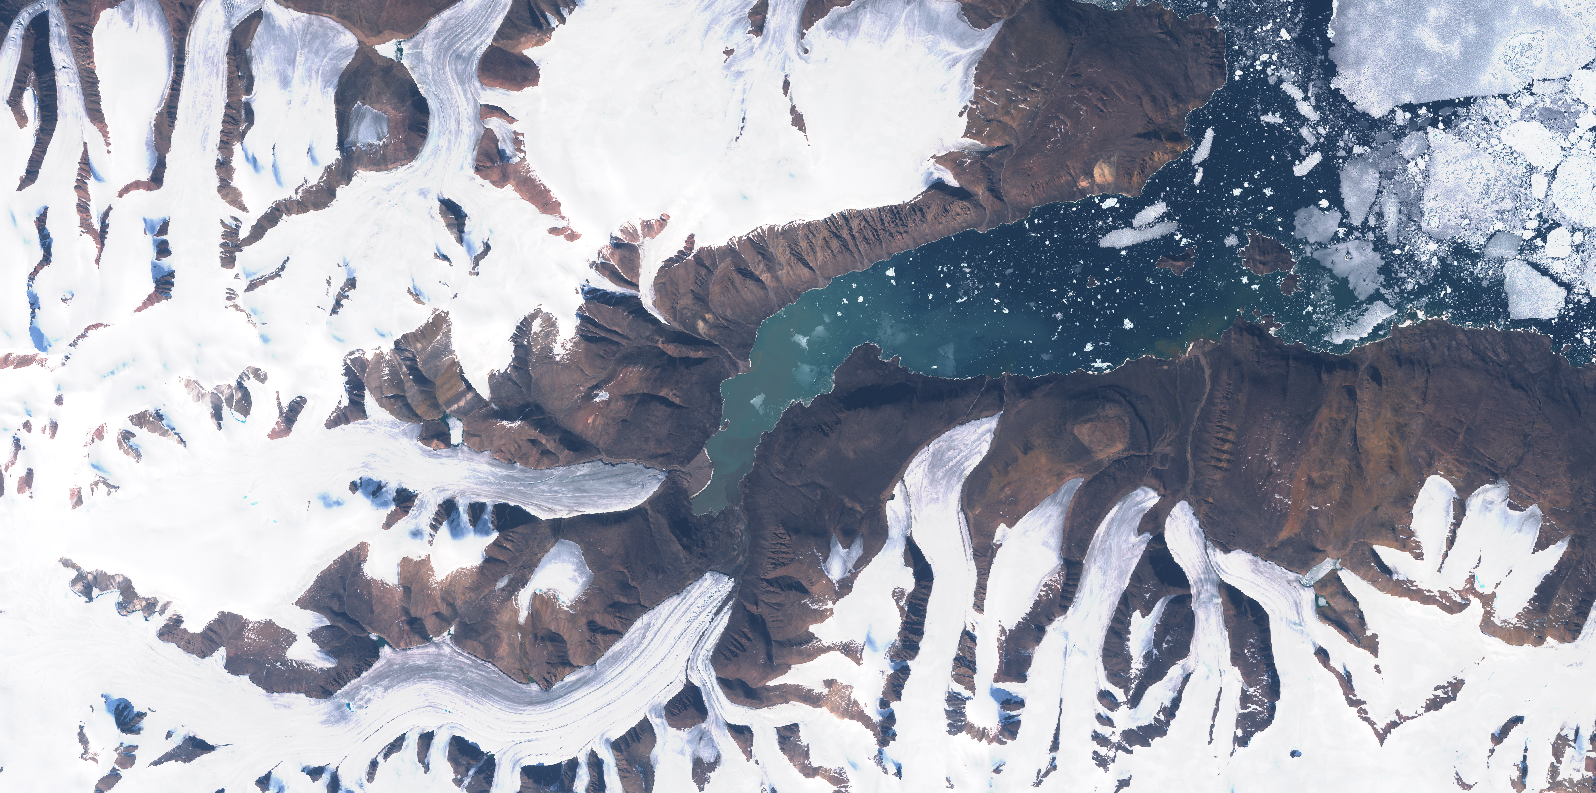
One more of Alexandra Fjord from space, because I can’t get enough of the staggering beauty of these landscapes. [Source: Sentinel 2 L1C on July 17, 2019]
Greetings from Delft on Day 10 of quarantine! These are strange times indeed, on so many levels. I am fortunately still safe and healthy at home in Delft. Let’s all keep our hands washed and fingers crossed in the weeks to come, and STAY THE FRIG HOME! We’re all in this together.
I have in part been occupying myself with preparing online lectures for our Coastal Dynamics course. We are extremely fortunate in that most of the course was already available online due to preparations made in previous years, but the lectures I was meant to give this week on tidal inlets were not. I changed a bunch of things in the slides last year, so we had a number of student requests to record new lectures. We live in an era where online education was already becoming more and more the norm, and I think this crisis will just push that trend over the edge.
With that in mind, I decided to try my hand at narrating the slides using Kaltura, a program for doing video capture. There are a few different options out there, but that was the one that I liked best. I have actually been having a lot of fun with the lectures- it feels like I’m hosting a podcast or on the radio. “GOOOOOOOOOOOOOOOOOOOOOOOOOOOOOOD MORNING QUARANTINE!!!!!” I suspect it wouldn’t be the most popular podcast (there are not so many of us ebb-tidal delta enthusiasts), but hopefully I can convert a few of our students in the process.
On Friday I prepared a lecture on the evolution of barrier coasts, such as the Dutch coast or much of the Eastern and Gulf of Mexico coasts of the US. I couldn’t help but share a few interesting links with the students, and I thought I’d post them here too. This is a really cool animation showing 30 years of barrier island and tidal inlet evolution on the southeastern coast of Australia, obtained via satellite imagery:
Ending the week with some spectacular coastal geomorphology at Victoria’s Corner Inlet, captured using 30 years of @USGSLandsat data.🛰️
This area is cloudy and difficult to map using satellites – this animation using a rolling median to get a clean view over time #DigitalEarthAUpic.twitter.com/s0cB8lLvDr
— Dr Robbi Bishop-Taylor 🛰️ (@SatelliteSci) March 6, 2020
There’s also the iCoast tool developed by the US Geological Survey for training their machine learning algorithms to recognize storm damage to barrier islands from hurricanes. It shows you to see before and after photos, and asks you to tag the changes or damage that you see, which is a great way to learn more about coastal geomorphology. You’re also helping the USGS improve their detection algorithms- citizen science!: https://coastal.er.usgs.gov/icoast/
To keep myself sane/busy this weekend, I bought a linocut printing kit from the printing shop around the corner from my house (Indrukwekkend, which means “impressive” in Dutch- I love puns that work in more than one language!). I had always wanted to try it out, but never made time for it. No time like the present! I took one of my old sketches of waves (see here for the original inspiration) and made a print of it. By the end my desk was an unholy mess of ink, but I had a lot of fun and found the linoleum carving to be very therapeutic. See the top of the page for the finished product!
That’s all for now. Stay sane and healthy, readers! And be kind to one another.
When I started this blog, I wanted to focus mainly on things related to coastal science and engineering, but for a moment I’d like to post something more personal. A few of my close friends and colleagues have had a tough week, but has also been an eventful one on the world stage.
The violence and political turmoil following the killing of Qassem Suleimani last week has been awful and frightening, but on Wednesday things took an unexpected turn for the worse. A civilian airplane carrying 176 people crashed, apparently shot down not long after it took off. It later emerged that 63 of those passengers were Canadian, and the majority of those on board were en route to Canada.
It wouldn’t matter where they were from or where they were going, it would still be an immense tragedy and terrible waste of human lives. But this one really hit me hard because as I read through the stories of all the victims, I was struck by a simple fact: a significant proportion of the 63 were science and engineering grad students or recent graduates, just like me. They were all just coming back to school after visiting their families for the holidays, just like I did last week. Just like most of my friends here.
One of my closest friends from home is an Iranian-Canadian engineer, and many of my TAs at the University of Waterloo were Iranian. I can’t help but think of them, and of all my friends and colleagues when I read about the people who were on that plane. Bright people with lives and stories, minding their own business, just going back to school or work.
2020 is not off to the greatest start so far, but we have to hope it can get better, and we have to do our best to make it so, even in our own small way. As my mom says, “never give up a chance to be kind”. Let’s start with that.
I recently paid a visit to my grandmother in Glasgow, Scotland. She is 94 1/2 years old and is still a delight to be with. Since she is living in a retirement home now and doesn’t get out much these days, I rented a car and we went for a drive together down the coast to Troon:
On our way back to Glasgow I pulled over the car in Ardrossan and grabbed a handful of sand from the beach there:
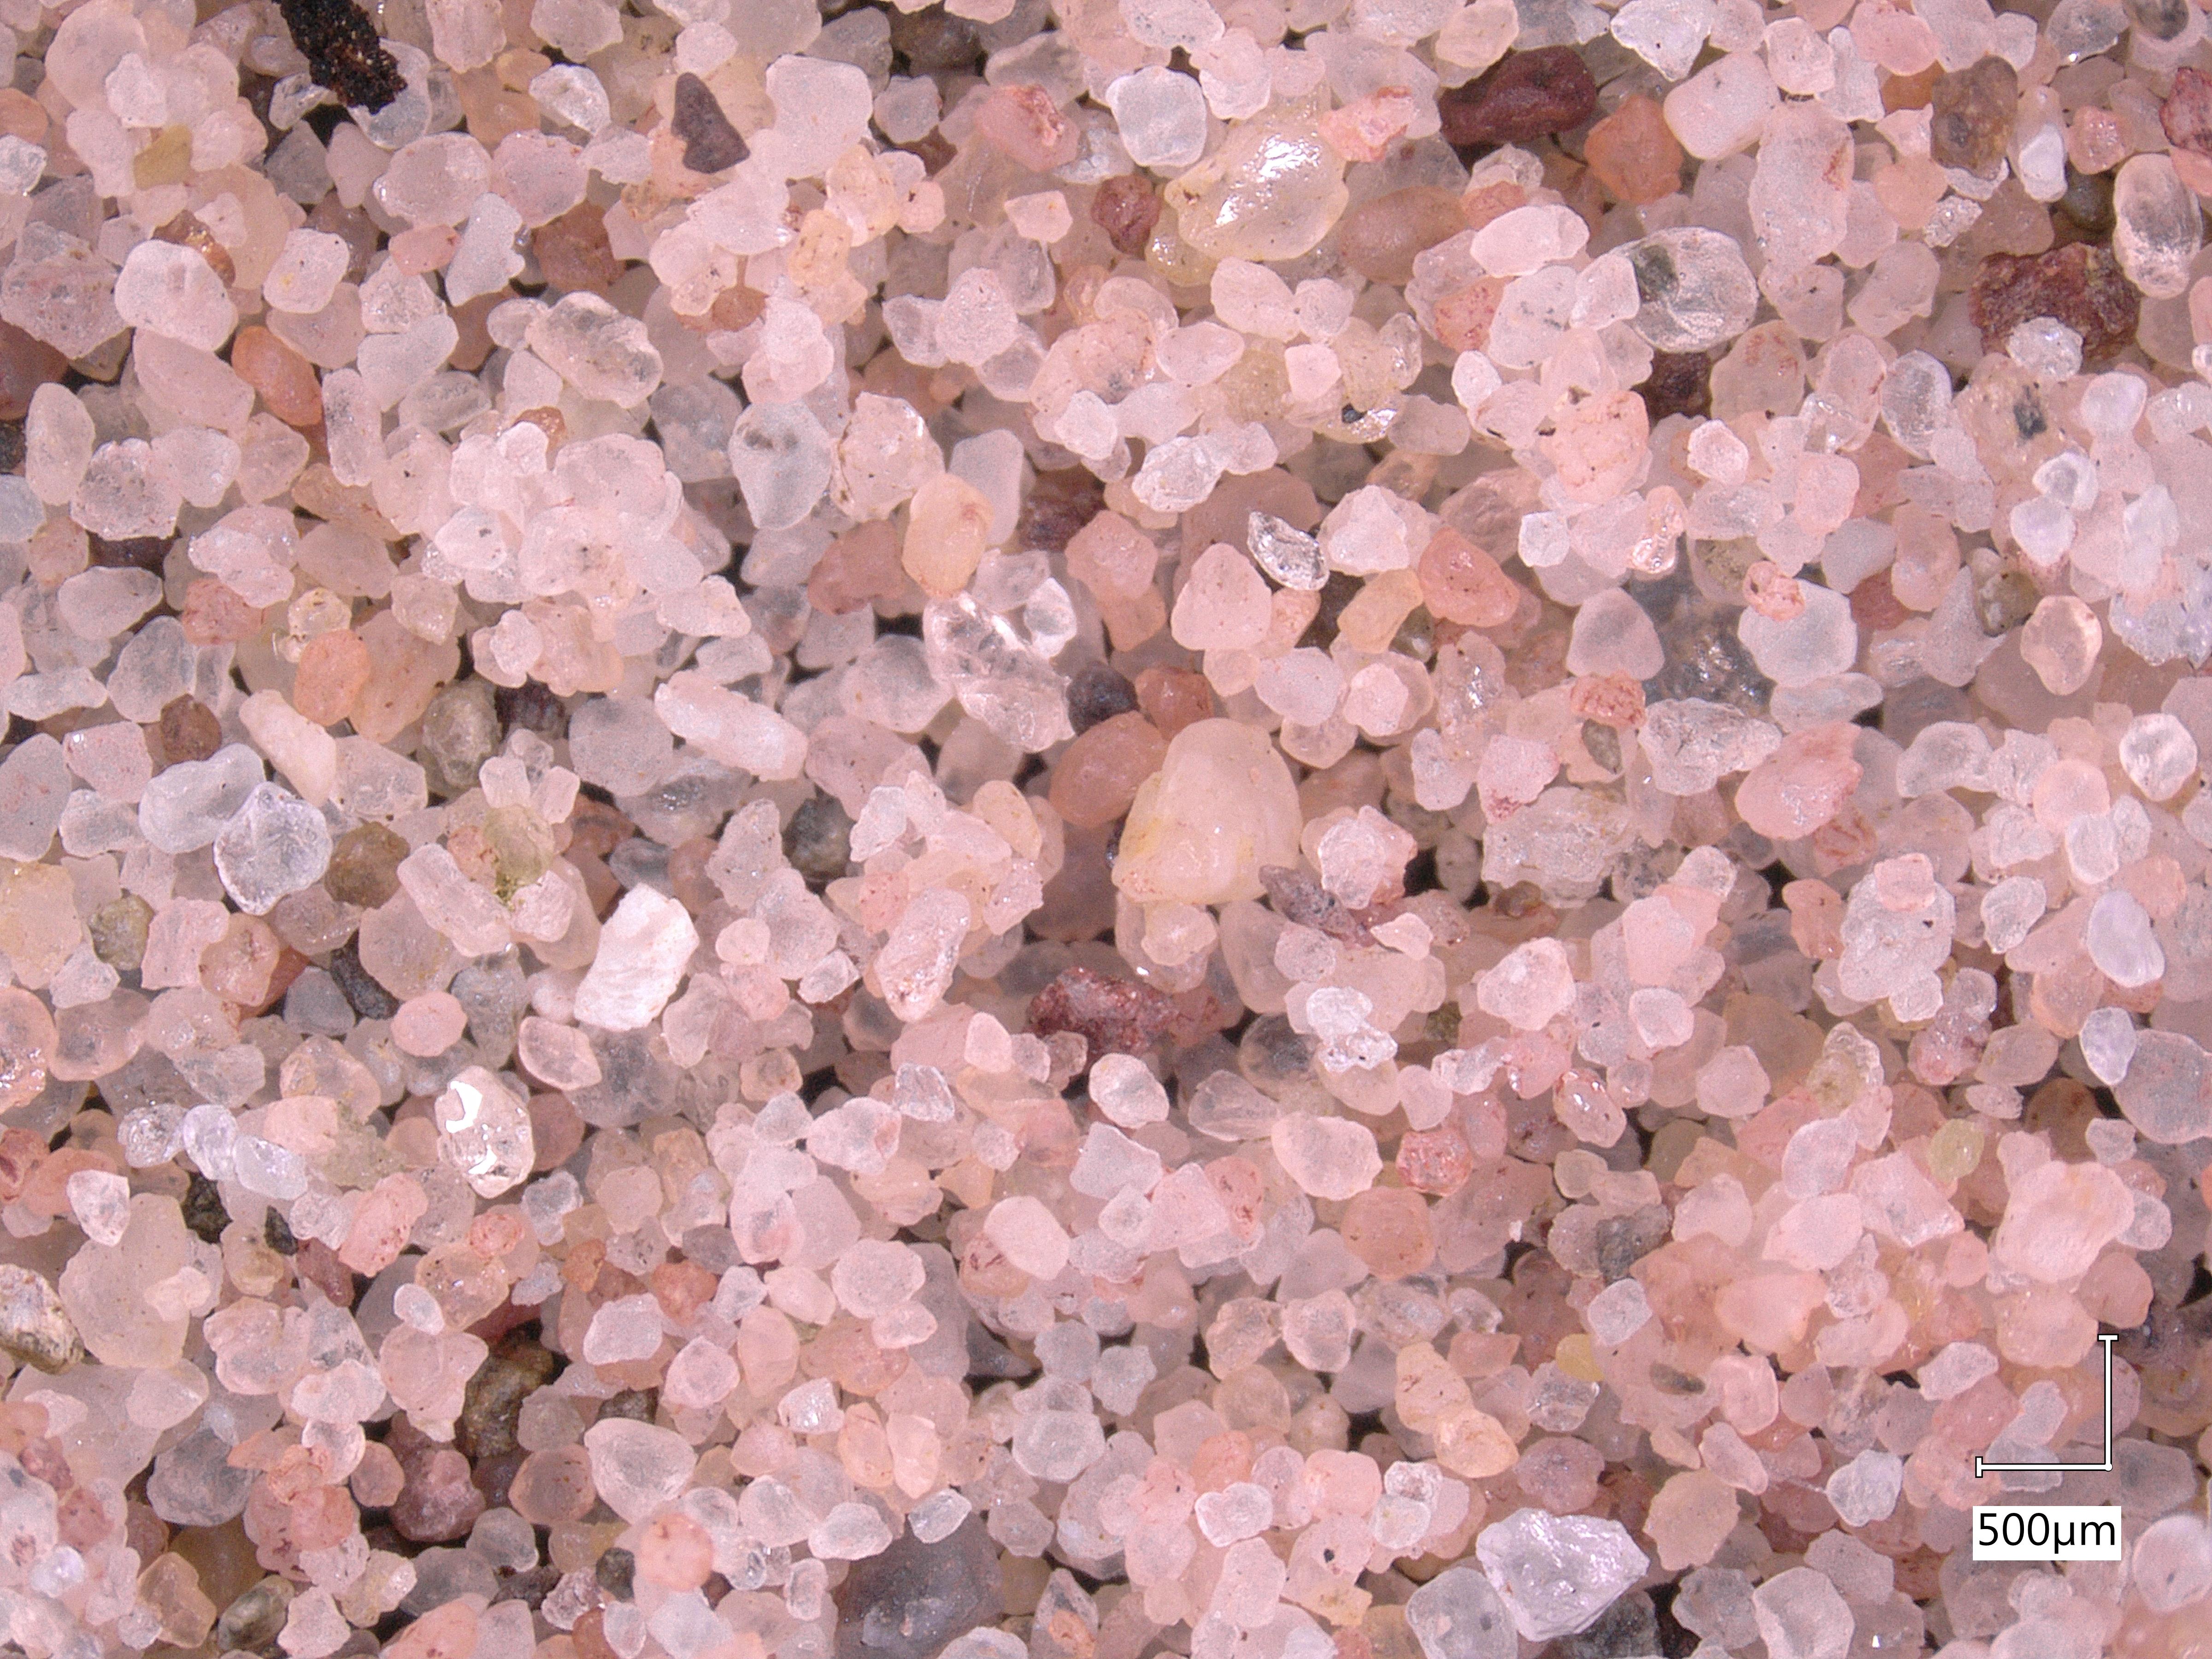
Sand from the beach at Ardrossan, Scotland. It appears to be fine, well-rounded quartz sand. Note the beautiful red tint of the grains.
When I showed my dad this photo, he pointed out that the pink sand grains resembled the red sandstones found in houses and buildings all across Glasgow, the city where he grew up. When I looked into it further, it seems that many of the sandstone bricks used in facades across the city indeed came from Ayrshire, where this beach was located. This is backed up by a geological map of the Firth of Clyde, which shows our little beach comfortably inside the red sandstone zone. A delightful convergence of sediment and architecture!
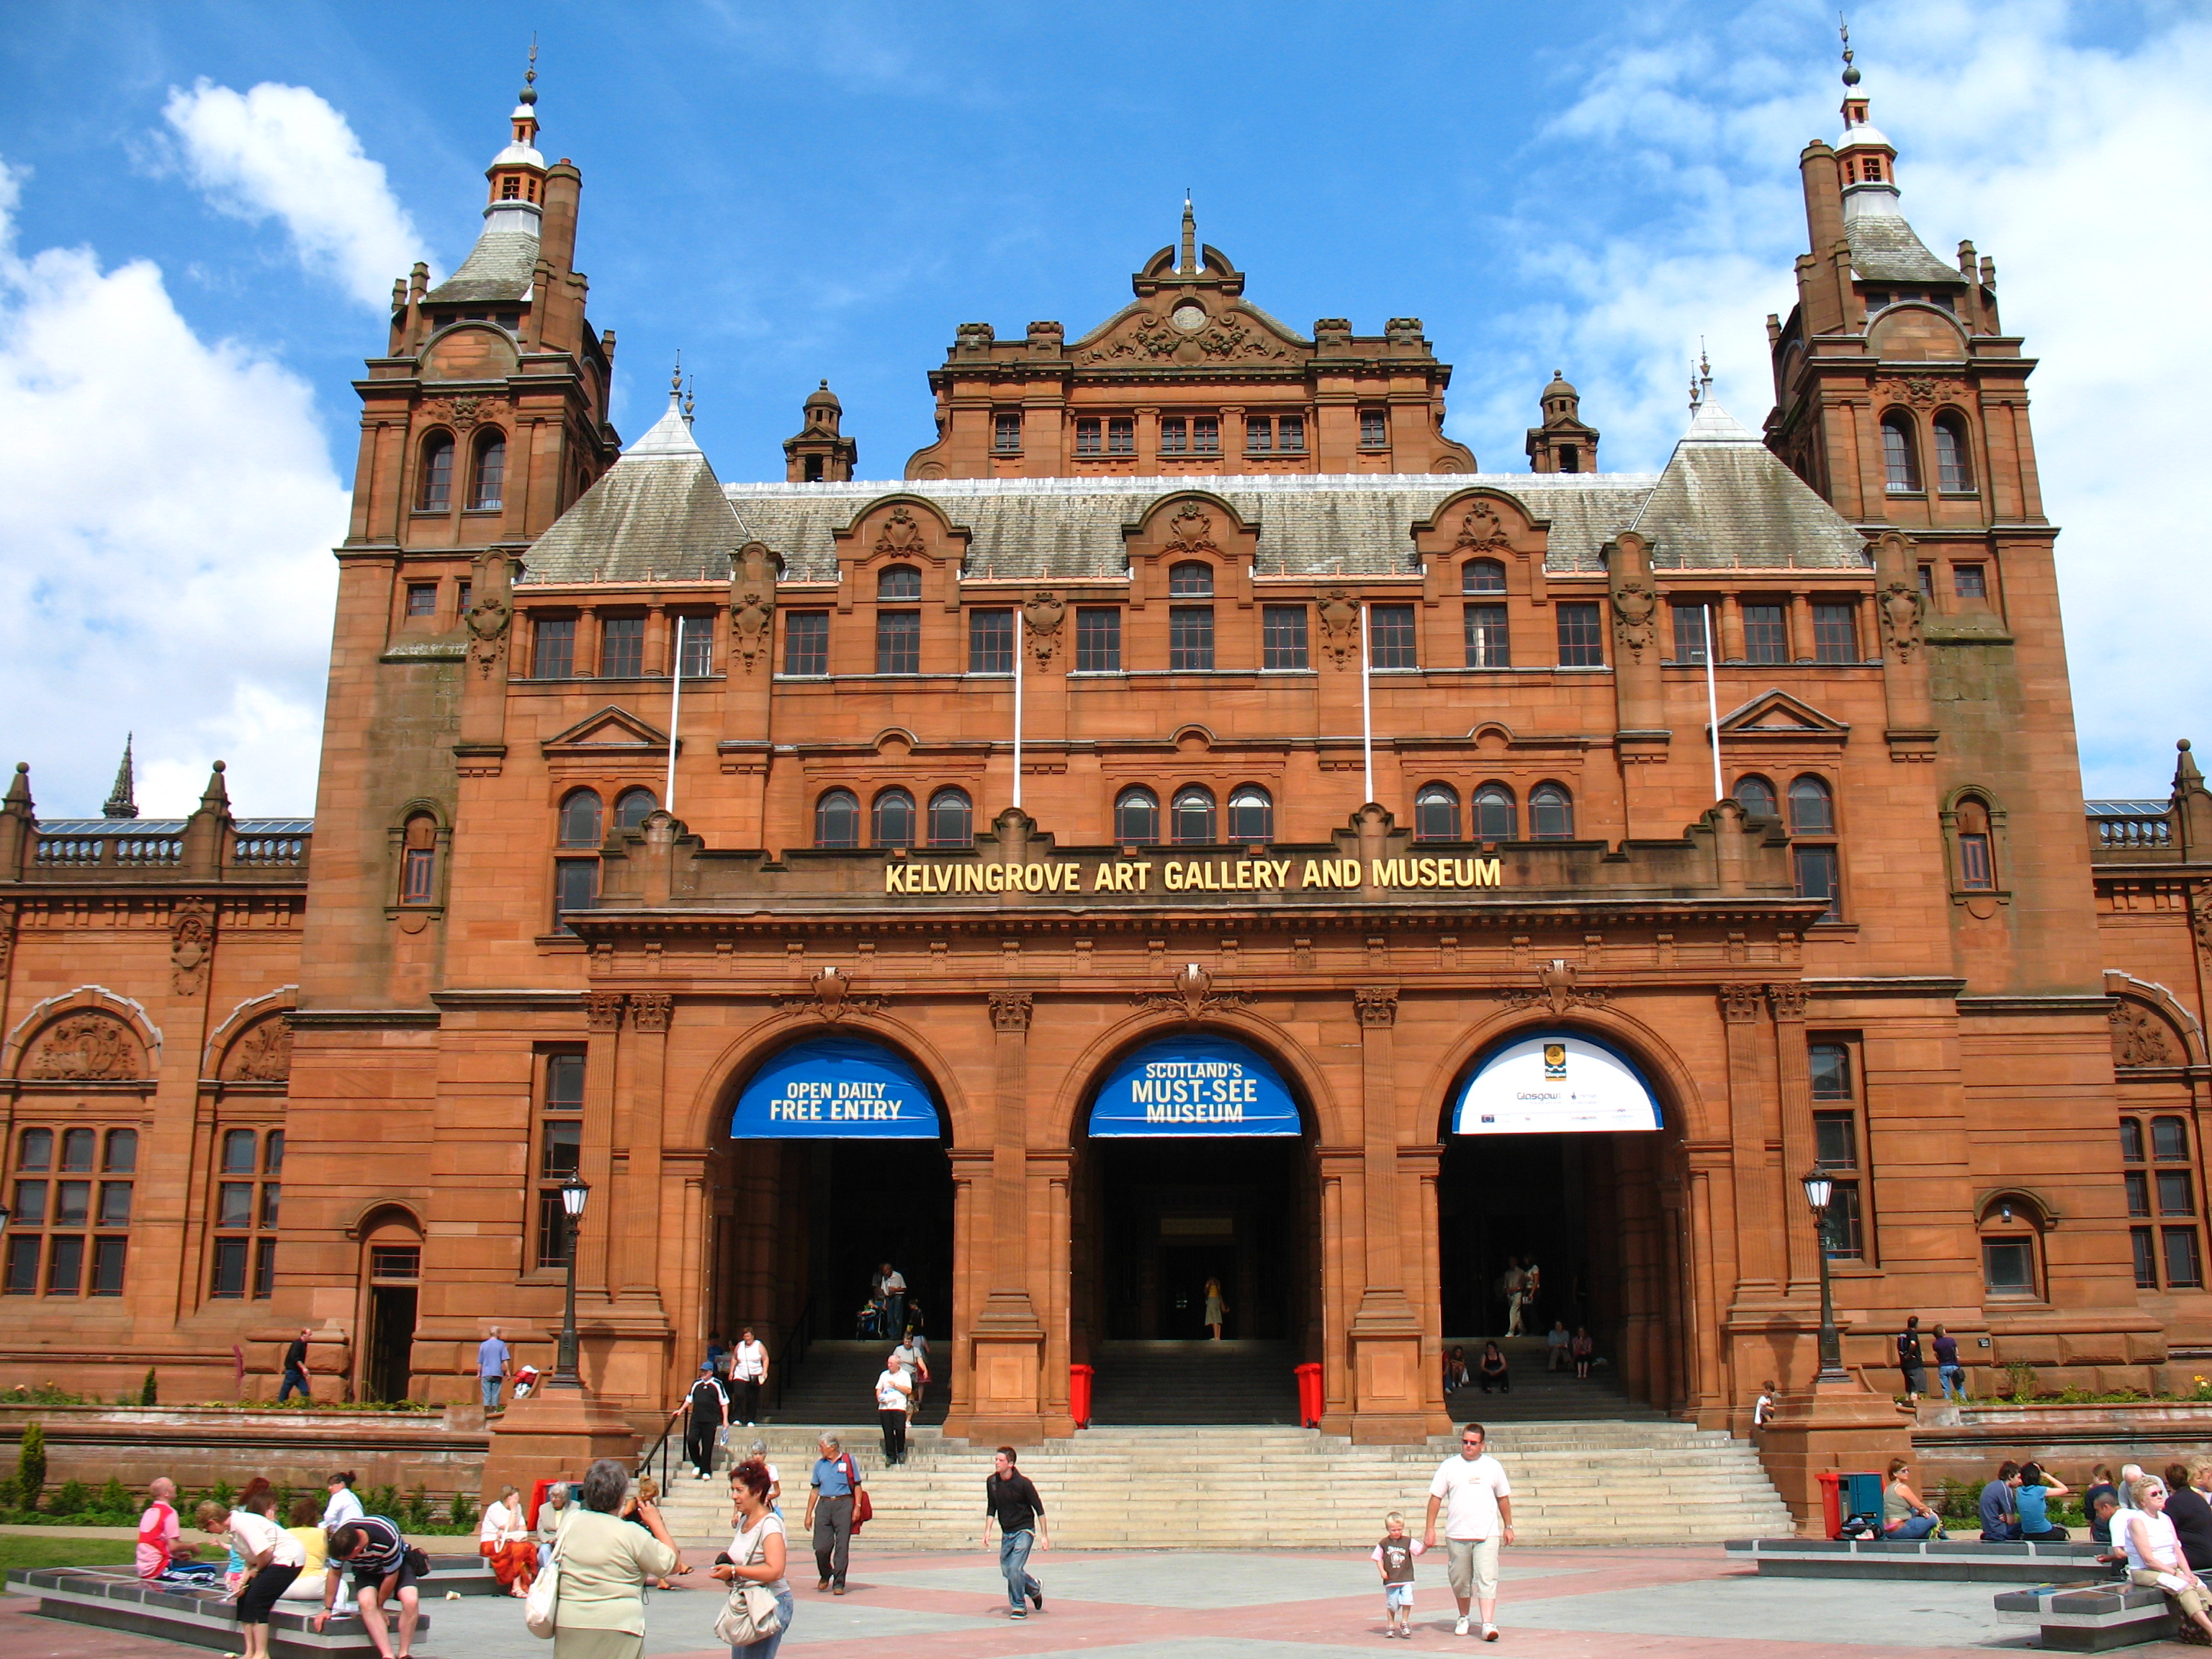
The Kelvingrove Gallery, one of my favourite places in Glasgow. If you ever find yourself in Glasgow I highly recommend it- it’s free! Note the beautiful red sandstone facade.
That’s one of my favourite things about this field- there always seems to be new and interesting connections back to other things that I love!
Majestic highland cows in Pollock County Park, Glasgow. Note their beautiful red sandstone facades.
Today I received the sad news that Gerbrant van Vledder, an assistant professor at TU Delft, passed away unexpectedly last week.
Many in our field know him for his work with SWAN, but I would like to shine a light on something else: his research on using wave models to understand how the people of the Marshall Islands have used wave diffraction around islands to navigate their boats for centuries.
Gerbrant had a strong curiosity about using modern tools to find an overlap with more traditional ways of perceiving the world around us; to listen to voices that were not often heard, and find their scientific merit. I think this was unique among engineers, and a really inspiring example. Whether you knew him or not, I encourage you to check out this fascinating article in which his Pacific adventures were featured:
Although I hadn’t spoken to him much recently, Gerbrant was very supportive during my MSc thesis, when I was researching the impact of waves on low-lying tropical coasts like those of the Marshall Islands. He showed a keen interest in my work, actually reading and giving feedback on my whole 232-page report! Given the dread with which I now confront verbose master’s student reports myself, I am especially grateful for the time he gave me. He supported my interest in Marshallese wave piloting, and with his encouragement, I eventually wrote a brief chapter in my thesis about it. I was lucky to have his experienced and critical eye on my side.
This all comes as quite a surprise. I still have a book that he lent me last year, which I haven’t given back yet…


