As a kid, I was obsessed with maps. Give me an atlas and I would be sucked in for hours. Eventually I wound up in coastal engineering and took a GIS course with the amazing Dr. Kate Parks in Southampton. This reignited my interest in cartography, as I now had the tools I needed to make my own maps. Over the coming years this led to an interest in how we can map our coastal regions to better communicate their morphodynamics. Also (mostly), I just wanted to make pretty maps! Making figures sometimes feels like one of the only avenues for artistic expression that we have in science.
To reach these goals, a good colourmap is a key ingredient. For a map showing the topography/bathymetry of a coast, a colourmap is the range of colours that correspond to a particular elevation. In this post, I will walk you through how I created two of my favourite colourmaps.
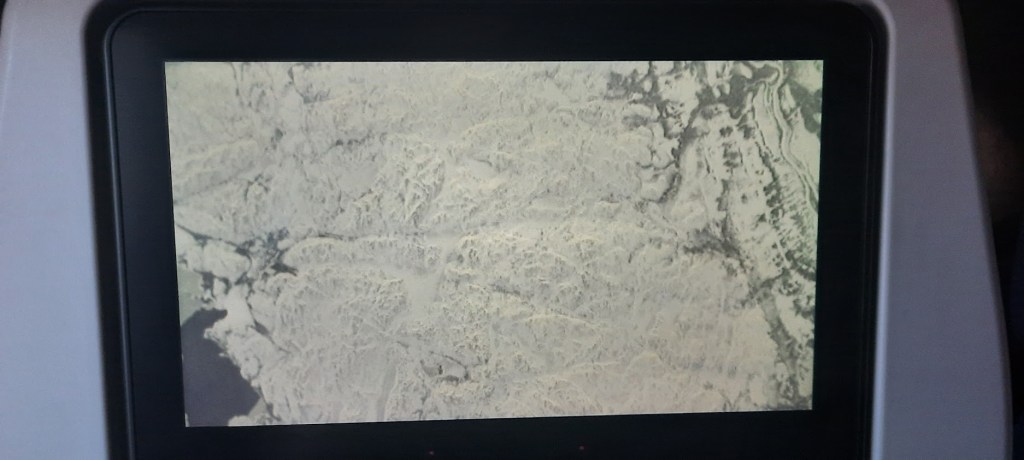
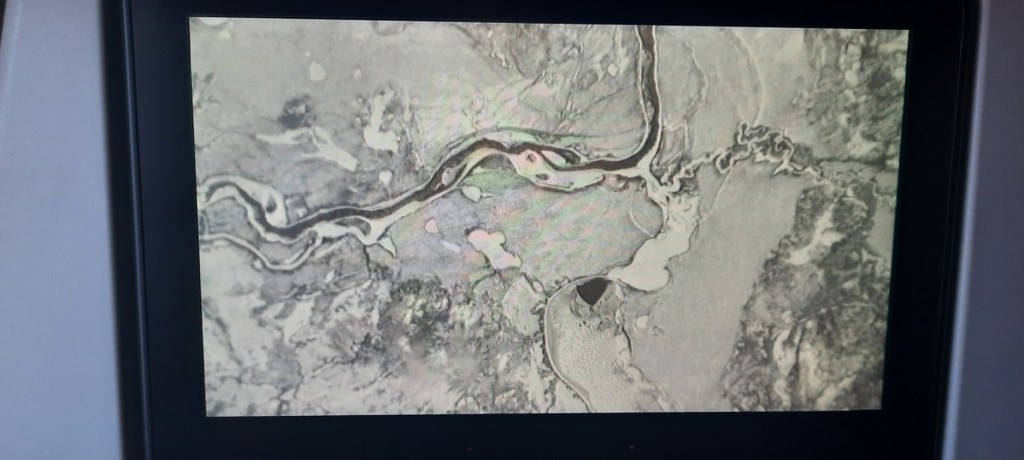
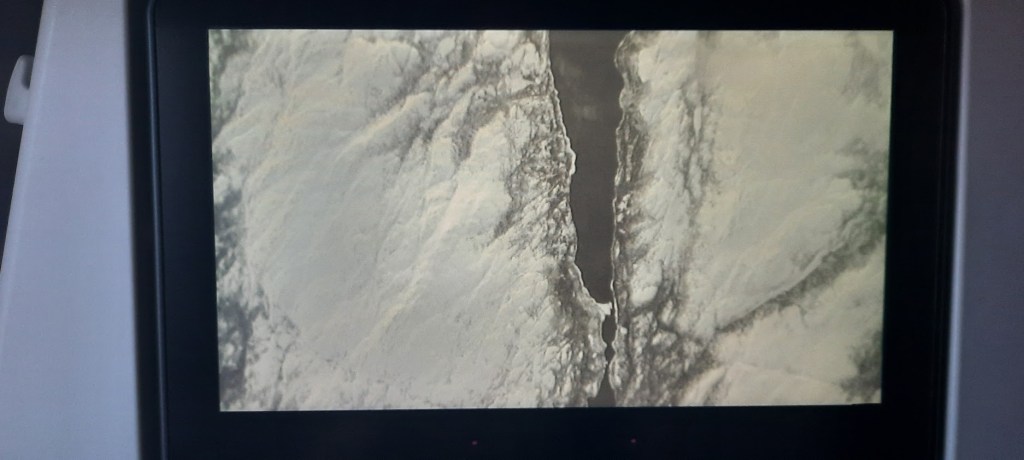
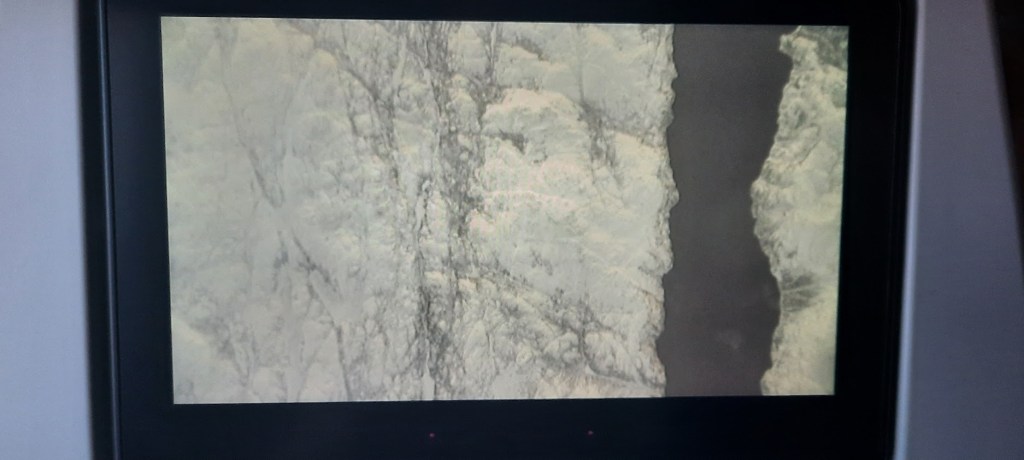
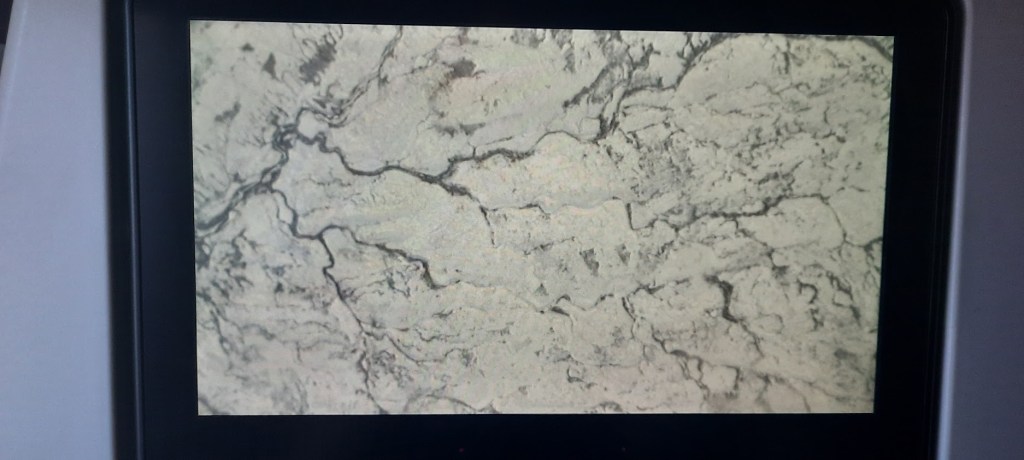
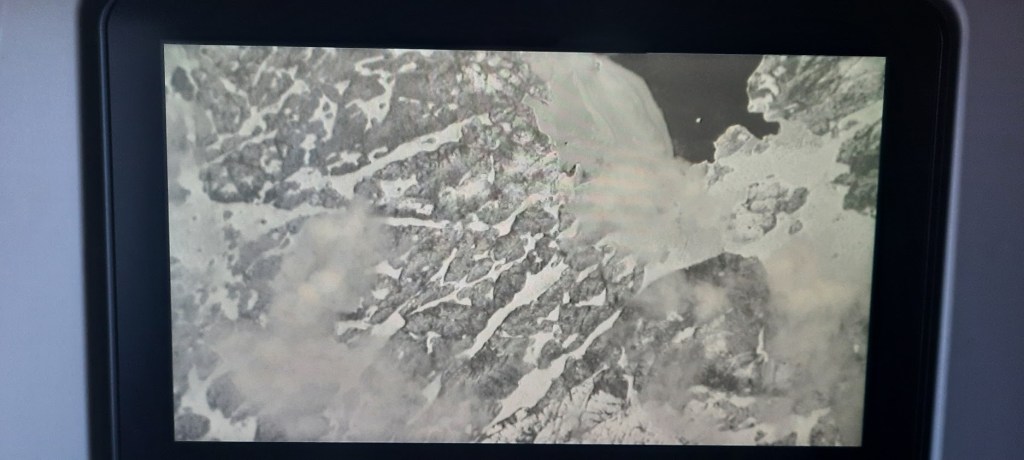
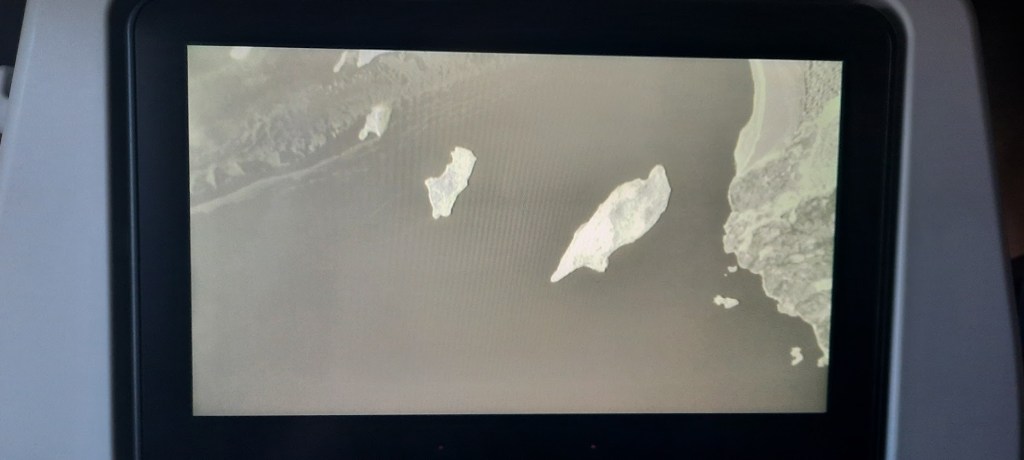
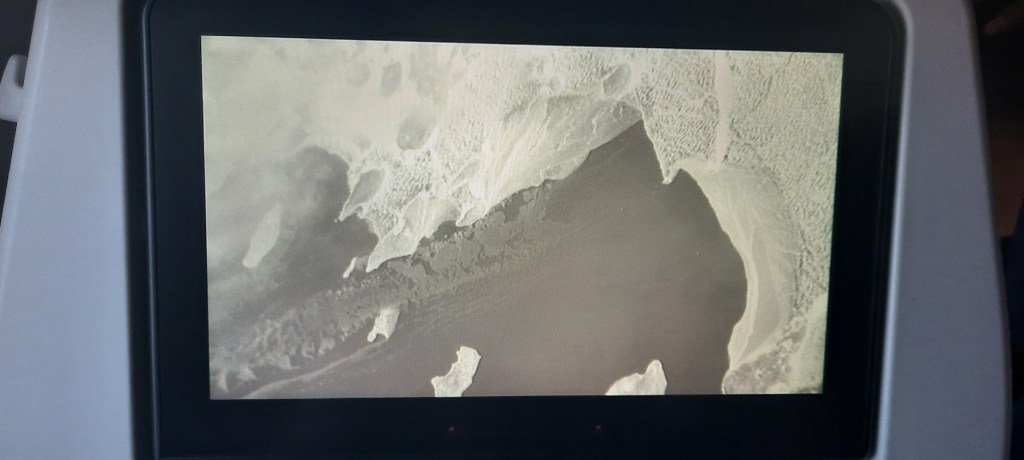
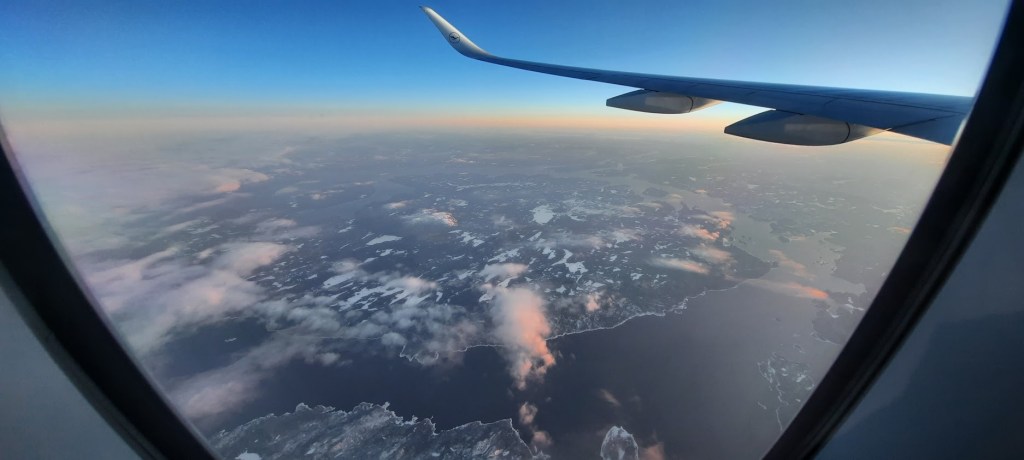
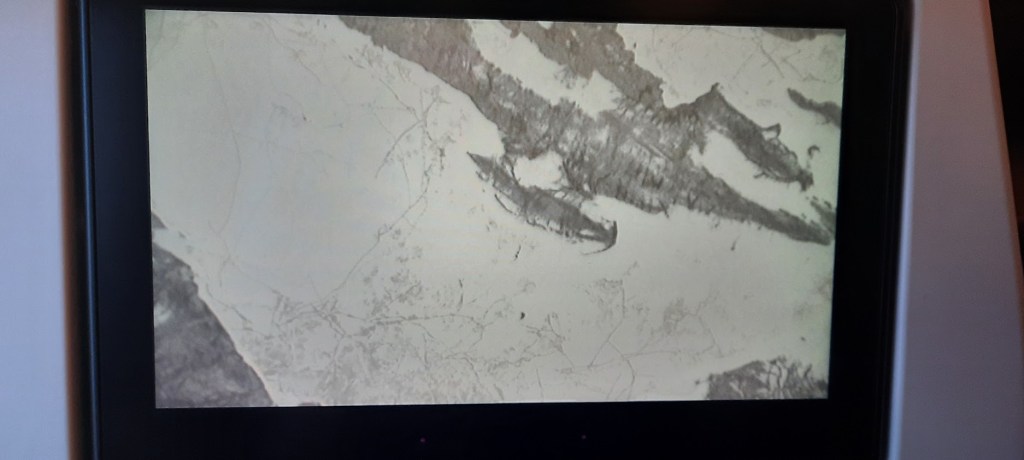
Yesterday, I flew home to Toronto from the Netherlands, after handing in my PhD thesis. The plane had a camera pointing straight down that you could watch via the screens mounted in each seat. We had clear skies coming in over Labrador, and I spent the next two hours staring at the ground ten kilometers below. I normally take a window seat when I fly back, but this time felt like a new way of seeing Canada, a sort of involuntary real-time scroll through Google Earth. These words jumped out at me like popcorn and I thought I would share them.
What if it got so cold That it snowed every day For a thousand years?
So much snow That it piled up in drifts Three kilometers high
And flowed out Like pancake batter Across a precambrian griddle
Milling old mountaintops Into flour Our collective geologic trauma
Ten million fjords All pointing Into the sunset
Through Caravaggio clouds Unfurling roses Obscuring violence
Scars revealed By reservoirs Cursed news from another star
Windblown white floes Serrate inky lakes Like polished granite
Black spruce Persisting through Their boreal blankets
Leopard stripes And zebra spots On a gneiss throw rug
But then a road Too straight for this fractal tapestry Points home
Here are some photos; the resolution and clarity obviously don’t do the view justice, so the poem is my humble attempt to capture some of what I saw.
Today is Liberation Day in the Netherlands, and marks the 75th anniversary of their liberation at the end of World War II. There were many Canadians involved in that operation, so today is often marked by celebrations of Dutch-Canadian friendship on both sides of the Atlantic. Since I can’t actually celebrate anything with my Dutch friends these days, I instead offer up this poem:
Due to my non-Dutch upbringin’
I can’t speak the language they sing in
So I took a Dutch course
Now I make my voice hoarse
As I try to pronounce Scheveningen
I really need help with my Dutch
Since I currently lack the right touch
I don’t mean to sound terse
But I just can’t converse
Though I like writing poems very much!
Your regularly-scheduled coastal science and engineering-themed blog posts will resume… eventually…
All hail the mighty squash!
Neglected by many
Loved by few
Such a noble vegetable!
There in abundance at my Albert Heijn
The lone survivor of panic-stricken shoppers
You stand defiantly on a shelf
With only wonky-looking peppers and carrots
To keep you company
But I see you, squash.
I recognize your beauty And your potential.
Together we will make
Wondrous pastas and curries
Soups, salads, and even pies
If my shitty toaster oven
Is feeling merciful
Greetings from Delft on Day 10 of quarantine! These are strange times indeed, on so many levels. I am fortunately still safe and healthy at home in Delft. Let’s all keep our hands washed and fingers crossed in the weeks to come, and STAY THE FRIG HOME! We’re all in this together.
I have in part been occupying myself with preparing online lectures for our Coastal Dynamics course. We are extremely fortunate in that most of the course was already available online due to preparations made in previous years, but the lectures I was meant to give this week on tidal inlets were not. I changed a bunch of things in the slides last year, so we had a number of student requests to record new lectures. We live in an era where online education was already becoming more and more the norm, and I think this crisis will just push that trend over the edge.
With that in mind, I decided to try my hand at narrating the slides using Kaltura, a program for doing video capture. There are a few different options out there, but that was the one that I liked best. I have actually been having a lot of fun with the lectures- it feels like I’m hosting a podcast or on the radio. “GOOOOOOOOOOOOOOOOOOOOOOOOOOOOOOD MORNING QUARANTINE!!!!!” I suspect it wouldn’t be the most popular podcast (there are not so many of us ebb-tidal delta enthusiasts), but hopefully I can convert a few of our students in the process.
On Friday I prepared a lecture on the evolution of barrier coasts, such as the Dutch coast or much of the Eastern and Gulf of Mexico coasts of the US. I couldn’t help but share a few interesting links with the students, and I thought I’d post them here too. This is a really cool animation showing 30 years of barrier island and tidal inlet evolution on the southeastern coast of Australia, obtained via satellite imagery:
Ending the week with some spectacular coastal geomorphology at Victoria’s Corner Inlet, captured using 30 years of @USGSLandsat data.🛰️
This area is cloudy and difficult to map using satellites – this animation using a rolling median to get a clean view over time #DigitalEarthAUpic.twitter.com/s0cB8lLvDr
— Dr Robbi Bishop-Taylor 🛰️ (@SatelliteSci) March 6, 2020
There’s also the iCoast tool developed by the US Geological Survey for training their machine learning algorithms to recognize storm damage to barrier islands from hurricanes. It shows you to see before and after photos, and asks you to tag the changes or damage that you see, which is a great way to learn more about coastal geomorphology. You’re also helping the USGS improve their detection algorithms- citizen science!: https://coastal.er.usgs.gov/icoast/
To keep myself sane/busy this weekend, I bought a linocut printing kit from the printing shop around the corner from my house (Indrukwekkend, which means “impressive” in Dutch- I love puns that work in more than one language!). I had always wanted to try it out, but never made time for it. No time like the present! I took one of my old sketches of waves (see here for the original inspiration) and made a print of it. By the end my desk was an unholy mess of ink, but I had a lot of fun and found the linoleum carving to be very therapeutic. See the top of the page for the finished product!
That’s all for now. Stay sane and healthy, readers! And be kind to one another.
I recently found a poem by Raymond Carver that really struck a chord with me, and I thought I’d share it for anyone else who is estuarily enthusiastic:
Where Water Comes Together with Other Water
I love creeks and the music they make.
And rills, in glades and meadows, before
they have a chance to become creeks.
I may even love them best of all
for their secrecy. I almost forgot
to say something about the source!
Can anything be more wonderful than a spring? But the big streams have my heart too. And the places streams flow into rivers. The open mouths of rivers where they join the sea. The places where water comes together with other water. Those places stand out in my mind like holy places. But these coastal rivers! I love them the way some men love horses or glamorous women. I have a thing for this cold swift water. Just looking at it makes my blood run and my skin tingle. I could sit and watch these rivers for hours. Not one of them like any other.
I’m 45 years old today.
Would anyone believe it if I said
I was once 35?
My heart empty and serene at 35!
Five more years had to pass
before it began to flow again.
I’ll take all the time I please this afternoon
before leaving my place alongside this river.
It pleases me, loving rivers.
Loving them all the way back
to their source.
Loving everything that increases me
– Raymond Carver
The image at the top of this post is of the mouth of the Columbia River, apparently at the beginning of flood tide. The plume of sediment and fresh water from the muddy river has extended out into the Pacific and mixed with salty seawater. Then, as the tide turns, it floods and brings the new mixture back into the estuary. This results in the second, inner plume pushing its way past the jetties. The contrasting physical properties of these two meeting bodies of water results in the beautiful patterns we see here. “The places where water comes together with other water. Those places stand out in my mind like holy places.”
Sources:
Carver, R. Where Water Comes Together with Other Water. Astley, N. (Ed.). (2011). Being Human: Real Poems for Unreal Times. Tarset: Bloodaxe Books.
Sentinel-2 L1C image from February 10, 2020 (Source: https://tinyurl.com/uze5feu). Image has been slightly enhanced to improve contrast.
Today’s sand sample is from Clatsop Beach, Oregon, on the Pacific Northwest coast of the US. Last summer I spent several months modelling sediment transport at the mouth of the Columbia River with the US Geological survey, and had the great privilege of making a site visit at the end of my stay.
Working in partnership with Oregon State University and the Washington State Department of Ecology, I assisted with a topographic survey of the beaches surrounding the Columbia. Half the team surveyed the submerged parts of the beaches via jetski, and my group walked transects across the beach and up the dunes using backpack-mounted GPS units.
Starting at far-too-early-in-the-morning, our team split off individually, and I had an entire kilometers-long stretch of the beach to myself until almost lunch time, when we reconvened. I love long walks on the beach and take great pleasure in that sort of solitude in nature, and it was even cooler to do that while collecting data that could help the project I was working on. The digital computer model I had worked on all summer was now suddenly a real place where I could feel the sand between my toes.
Gold in Them Hills
The sand at this beach is interesting because of the black grains we see scattered throughout. This sediment is made of minerals like chromite, magnetite, and garnet, which are heavier than the whitish quartz grains we see around them. These deposits, known as “placers”, were transported to the sea from the mountains inland by the Columbia River. They form on the beach because lighter minerals like quartz are preferentially sifted out by waves and currents, leaving more of the dense particles behind. This even includes trace amounts of gold! Can you see any in the photograph below?
Sediment sample from Clatsop Beach, OR. Note the black “placer” deposits of heavy minerals. Can you see any flecks of gold?
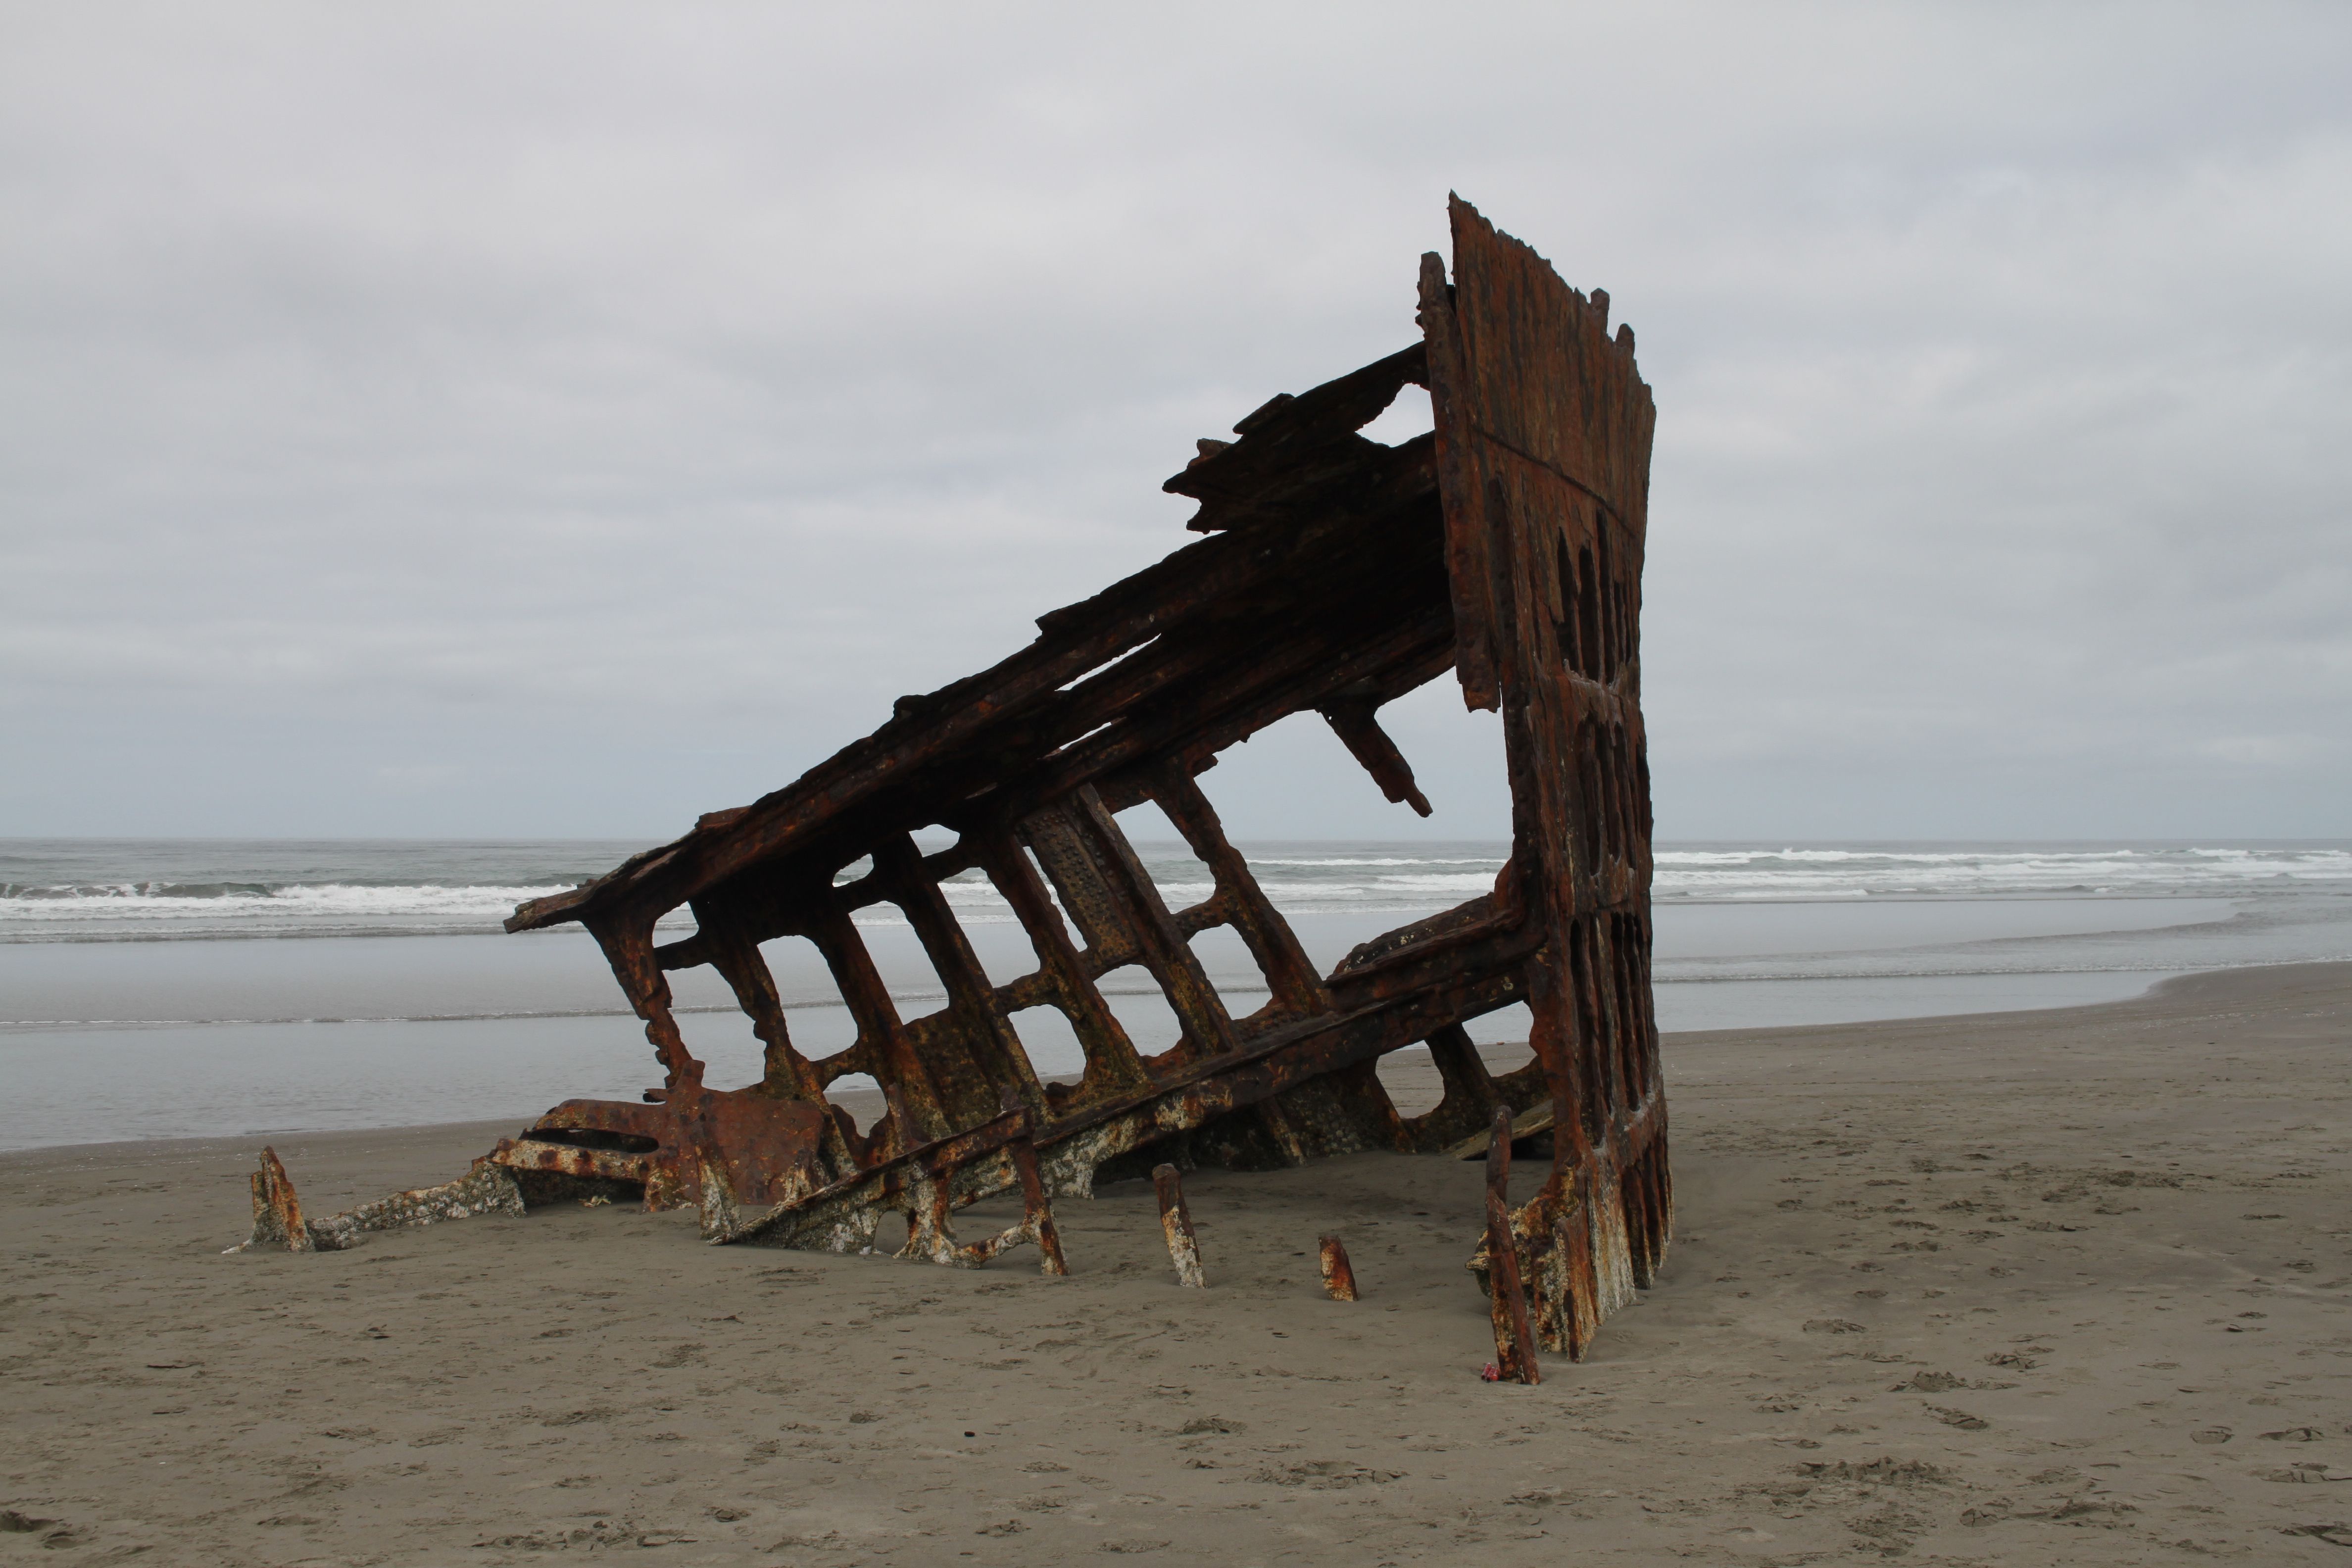
At the end of our survey, I walked along the beach to check out a surprising object emerging from the sand: the wreck of the Peter Iredale, a sailing ship that ran aground there in 1906:
The Wreck of the Peter Iredale on Clatsop Beach.
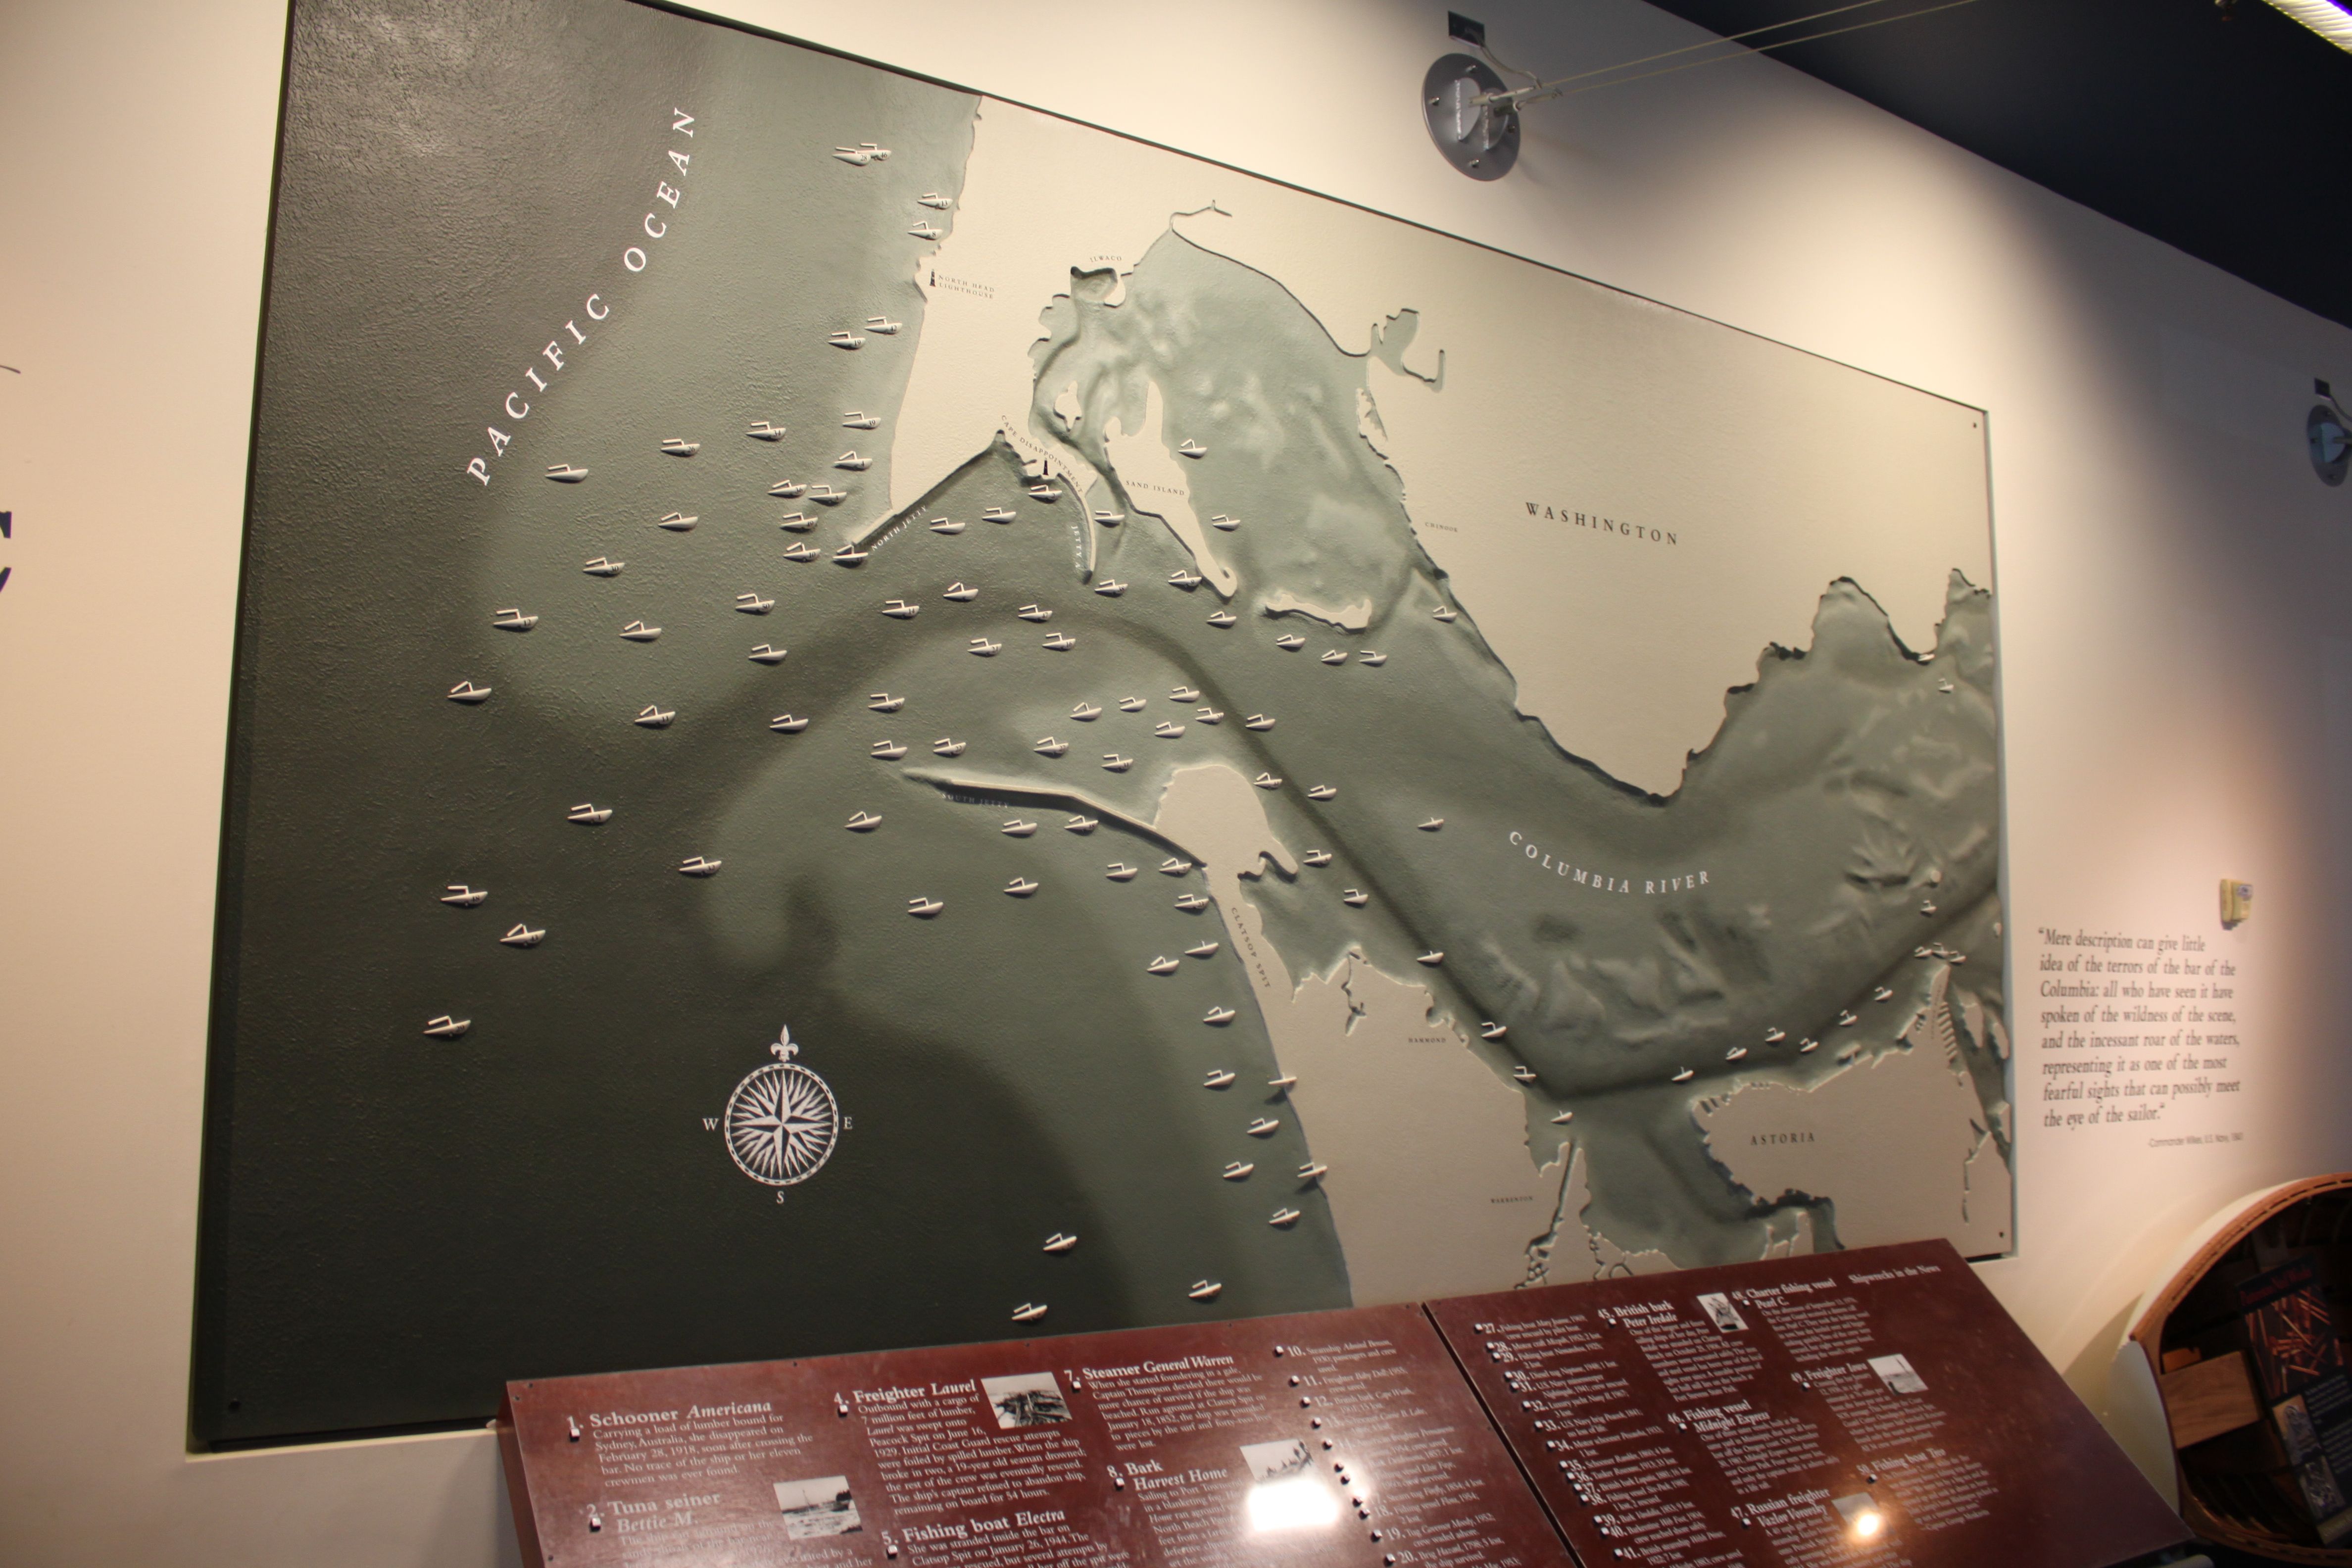
Known as the “Graveyard of the Pacific“, the mouth of the Columbia is truly a “killer ebb-tidal delta”: huge waves and powerful currents meet violently, and have caused dozens of shipwrecks over the past few centuries. This makes effective management of the sediment there crucial for safe navigation, keeping the shipping channel dredged clear and disposing of the sediment in environmentally-friendly, cost-effective, and useful ways.
Historical shipwrecks at the Mouth of the Columbia River, seen in the Columbia River Maritime Museum.
Strategic placement of this dredged sediment was the focus of my time at USGS last summer, but I will delve into that more in a future post!
Vancouver holds a special place in my heart. I was born out there, and even though we moved away when I was very young, it has continued to re-emerge in my life. In 2011, I moved out there after a difficult breakup and the city breathed new life back into me. While there, I discovered a new vocation in hydraulic modelling for predicting floods, something that I am still doing to this day. I have returned to Vancouver a number of times since then, since my brother and a surprising number of my closest friends have ended up out there. I hope to return this September for a wedding!
Coal Harbour, Vancouver.
One of my favourite parts of Vancouver is walking its coastline. The city was built on the edge of a large fjord, but has a variety of coastal landscapes, from towering cliffs to sandy beaches, mud flats to salt marshes, and of course a number of urbanized shorelines.
Even though I am in the Netherlands now, I am trying to keep my Vancouver connection alive through my work. Last year, I co-supervised a fantastic group of TU Delft students who worked with Kerr Wood Leidal and the University of British Columbia (UBC) to investigate the erosion of the Point Grey cliffs, on which UBC is situated.
Eroding cliffs of Point Grey. The University of British Columbia is at the top of the cliff, so naturally they are concerned with understanding the rate of erosion and means of slowing it.
The project was an interesting one, as the students (representing three different countries) tried to bring their lessons learned about Dutch coastal engineering to Canada. Canadian coastal zone management is much more fragmented than in the Netherlands, where everything is more or less centrally controlled by the federal government. The entire Dutch coastline is also incredibly well-monitored, with high resolution bathymetry taken every few years, and with countless other measurements available. Acquiring the data necessary to perform a coastal engineering study in Vancouver required contacting dozens of different sources and dealing with numerous agencies at multiple levels of government.
Sand from Wreck Beach. It is quite coarse and angular in shape, and the green and red tints are quite nice. Being glacial in origin, these sand grains have likely been bulldozed by ice or carried by meltwater from far and wide. This accounts for the variety of particles we see.
In the end, the students looked at a number of possible solutions for slowing the coastal retreat, including sand nourishments and revetments. One of the most intriguing concepts that they explored was the idea of a clam garden, a traditional approach from the First Nations people living on the BC coastline. Originally intended for aquaculture, clam gardens are usually small rock walls placed along gravel beaches, behind which where clam-friendly sand or mud can accumulate. However, this approach could have added benefits for coastal protection by attenuating waves and encouraging the deposition of sediment. In many ways, it is not that different from the Dutch using brushwood dams to reclaim land in the Netherlands or my colleagues using similar structures to rebuild mangrove habitats.
In Canada, the involvement of First Nations in coastal planning is becoming increasingly important (as I think it should be!), and there is a lot that science and engineering can benefit from their traditional forms of knowledge and experience. Building with nature instead of fighting against it has recently become a popular design philosophy in coastal engineering, and who better to have as allies in that task than the people who have been living with and building with nature already for centuries?
World War II-era bunker on Wreck Beach overlooking the Georgia Strait, with North Vancouver in the background.
The Delft-Vancouver connection continues: right now we have a group of five students investigating coastal protection solutions with Kerr Wood Leidal and the Tsleil-Waututh Nation. They have already been out there for a month, and I am excited to see what they come up with!
Sunset over the Spanish Banks, just around the corner from UBC.
This week we have some sand from Cannon Beach, Oregon, which is most famous for this big, beautiful rock:
Haystack Rock on Cannon Beach, Oregon.
Located on the Oregon coast just south of the Columbia River mouth, I passed through Cannon Beach last summer on my drive to Vancouver.
The most peculiar thing about this sand was that it squeaked when I walked on it. You read that correctly- it made a squeaky noise when you stepped in it, which was a delightful surprise. I had heard about this phenomenon before, but never experienced it myself. “God, that’s weird!” says one Youtuber after running their hands through the sand at Cannon Beach:
This “singing sand”, is due to localized shear: as you step into the sand, it causes the grains to rub past one another and generate sound [Humphries, 1966]. This tends to happen if the sand grains are well-sorted (all more or less the same size) and highly spherical [Lindsay et al., 1976]. In the photograph below, the sand grains don’t look particularly spherical, but they are indeed quite consistent in size (just compare with one of the more poorly-sorted samples we looked at in previous weeks).
Lindsay, J. F., Criswell, D. R., Criswell, T. L., & Criswell, B. S. (1976). Sound-producing dune and beach sands. Geological Society of America Bulletin, 87(3), 463-473.
Vriend, N. M., Hunt, M. L., Clayton, R. W., Brennen, C. E., Brantley, K. S., & Ruiz‐Angulo, A. (2007). Solving the mystery of booming sand dunes. Geophysical research letters, 34(16).
A few weeks ago, I shared some sand that my dad brought back from the Butt of Lewis. On that same trip, he and my mom went to visit the island of Barra, where her family originated from before emigrating to eastern Canada in the 1770s.
Halfway through their holiday, I received an excited text message from my dad: “Tell me – the whole island seems like grey granite, so where does the white sand come from? (In fact all the west side beaches are white sand.) Is it coral?”
Eager for a distraction from my work, I did a quick lit review. The consensus seems that indeed, the white sand on the beaches has almost nothing to do with the gneiss found on the rest of the island. In essence, it seems as though most of the original sand was bulldozed there by glaciers during the last ice age or brought there by meltwater as they retreated. Then over the course of the past few thousand years, shell fragments have accumulated and overwhelmed the native glacial sand, making up 7.5% to 82.9% of the total sand. This results in the beautiful white beaches that you see today (Jehu & Craig, 1924; Goodenough & Merritt, 2007).
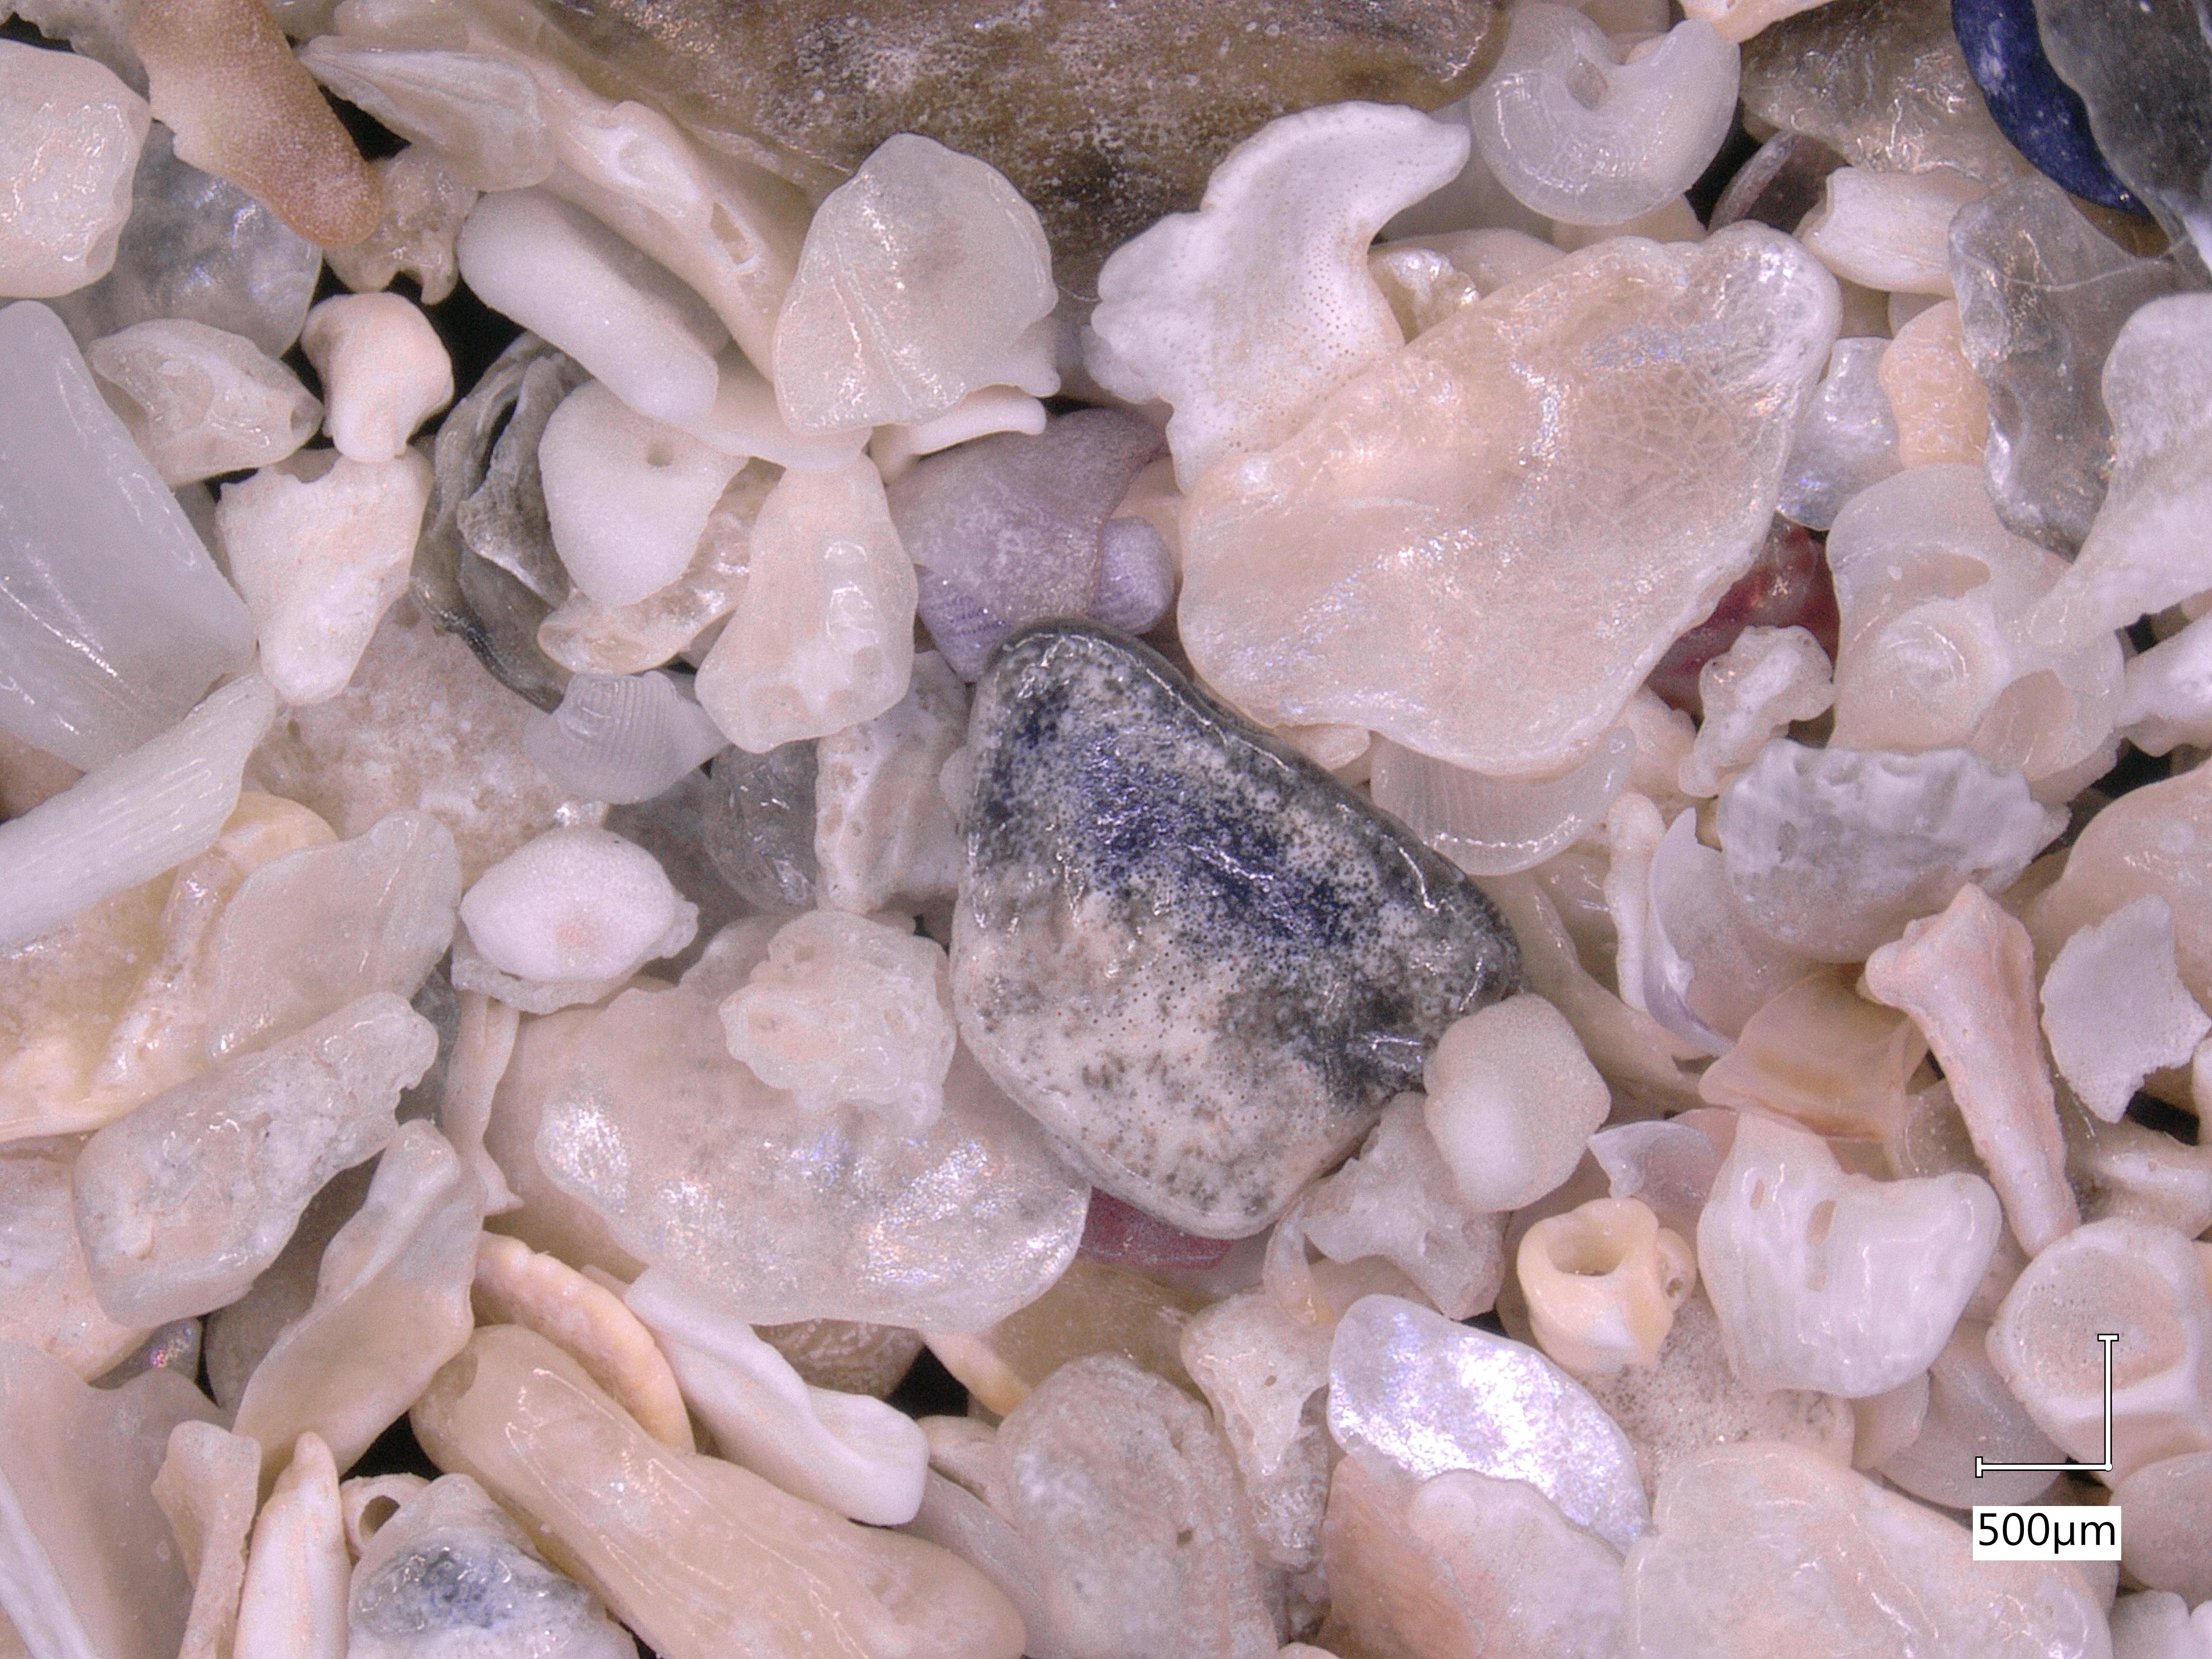
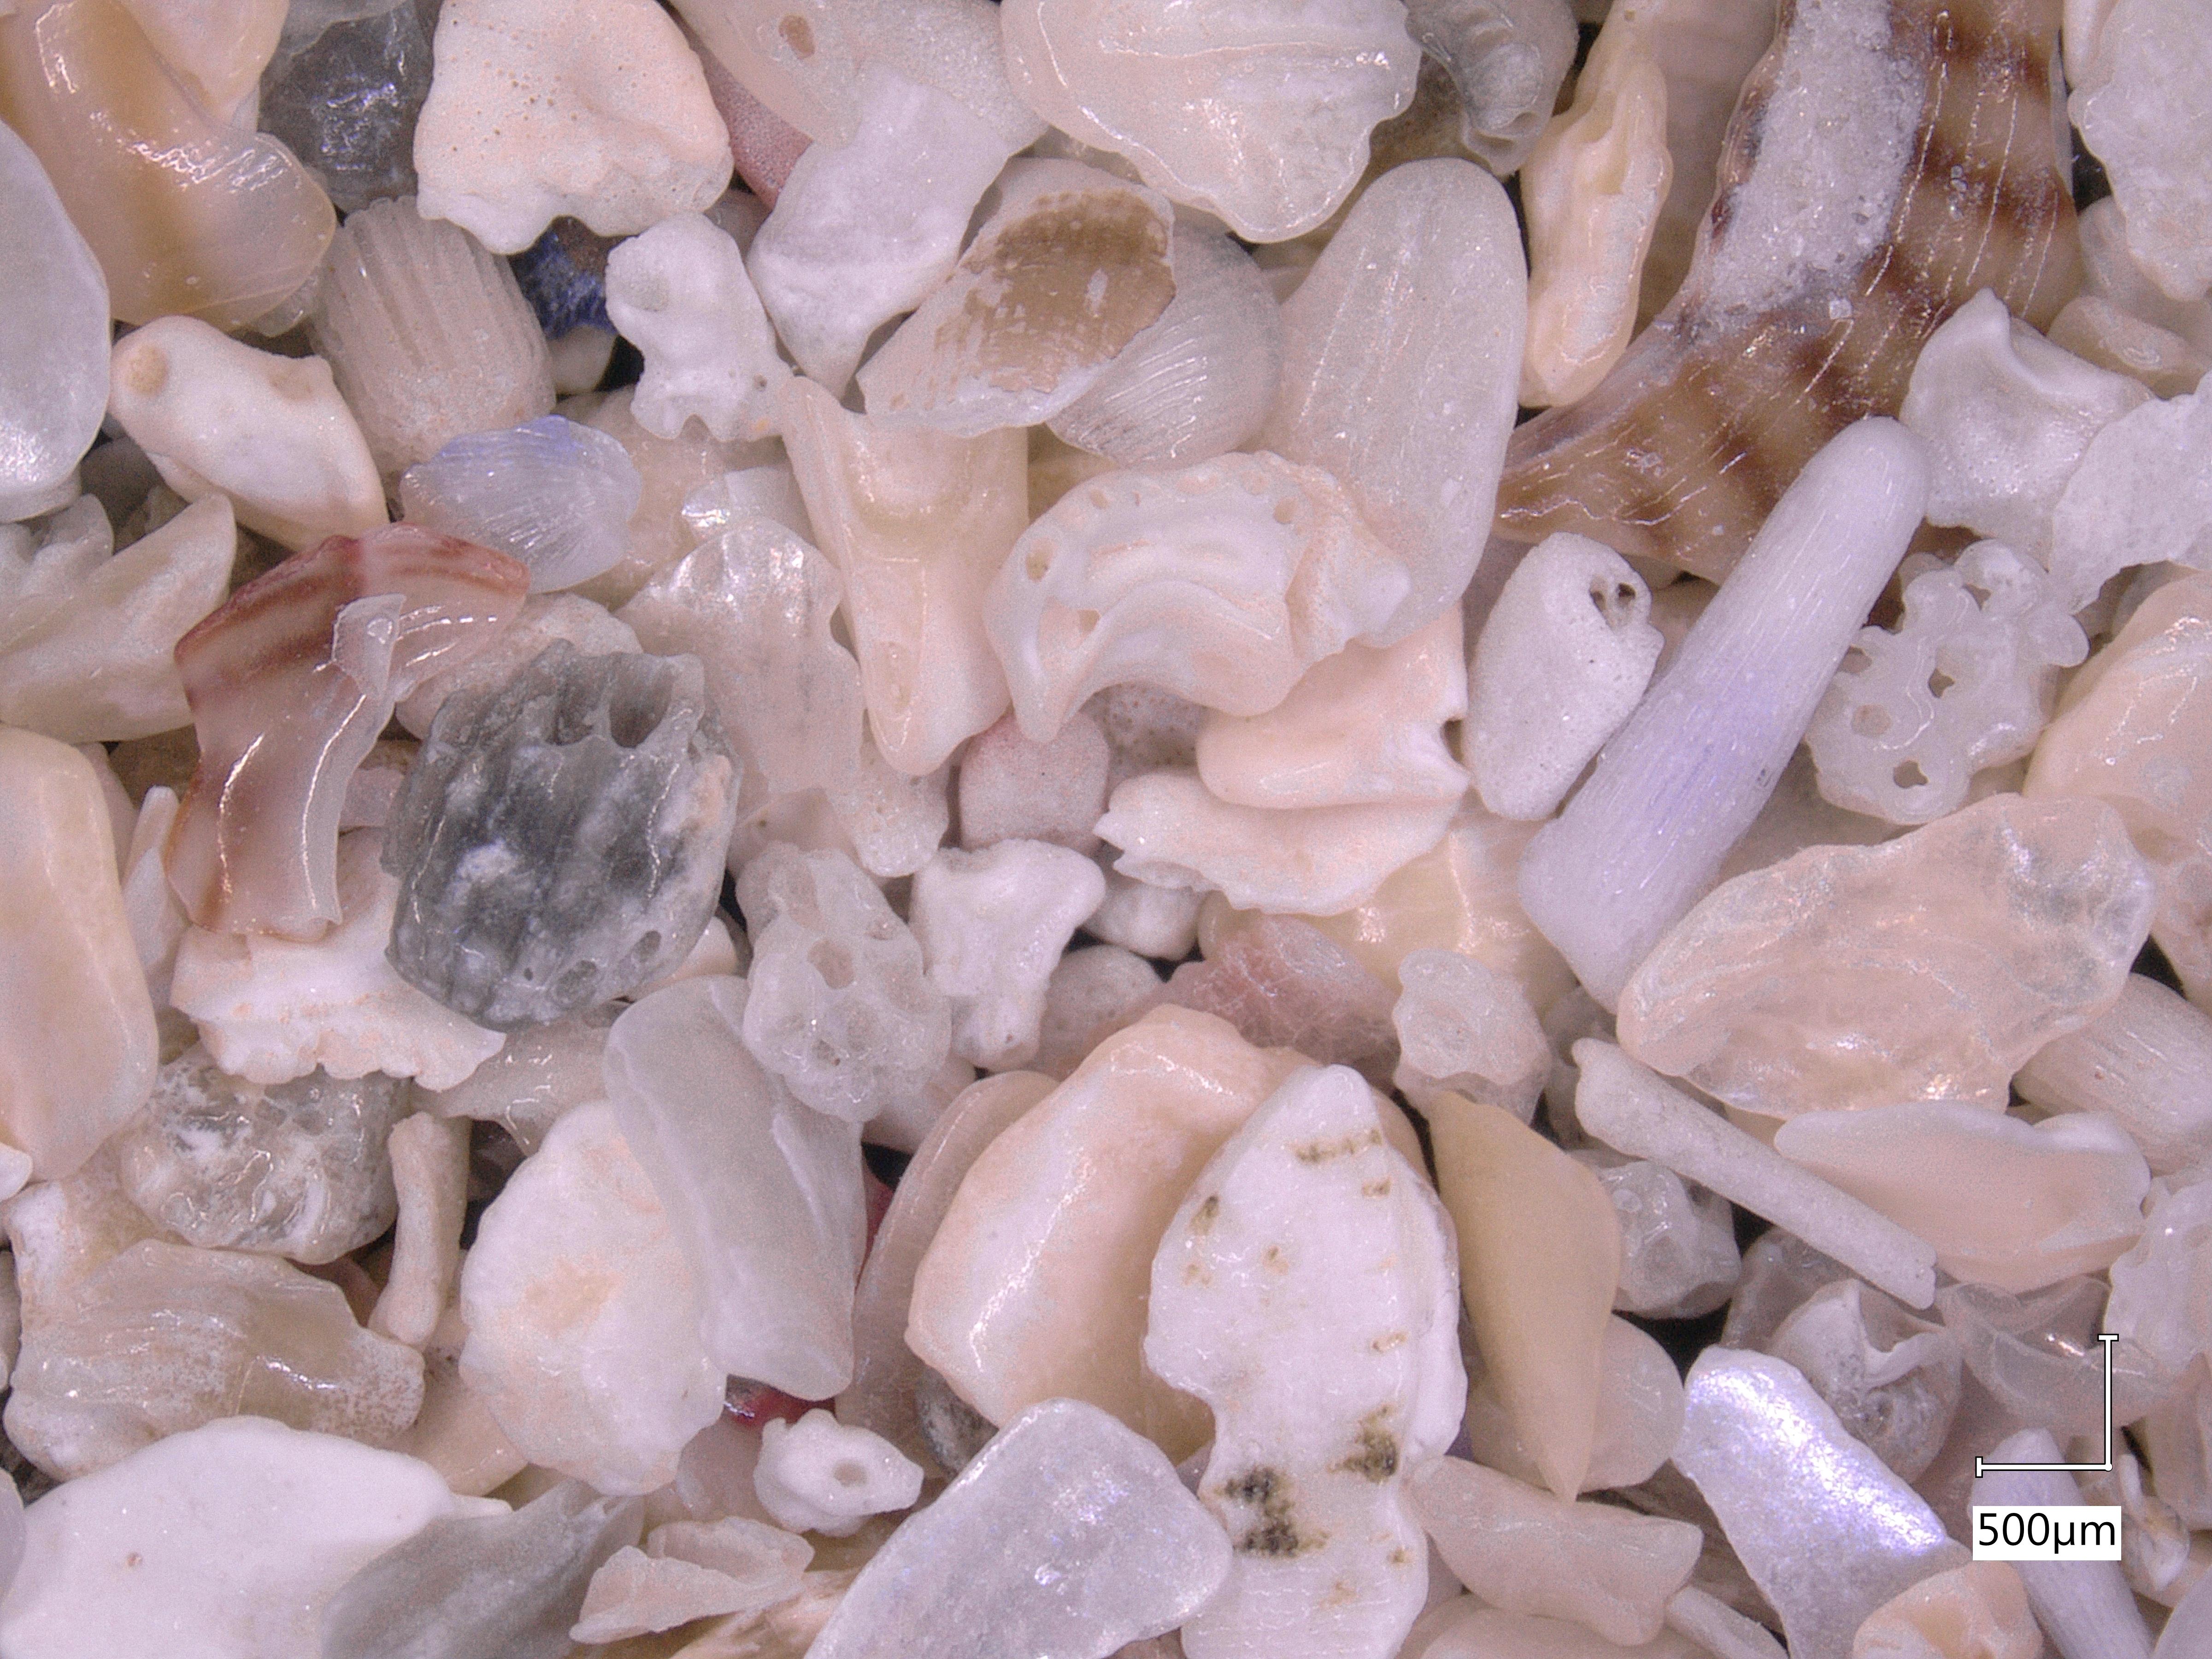
This might be my favourite sample of sand that I have analyzed yet- it is incredibly shelly, and every photo reveals beautiful new shapes and patterns. I think I will just let the sand speak for itself:
When you zoom out, it doesn’t look like much…
…but zooming in reveals all sorts of interesting shell fragments with different structures and colours.
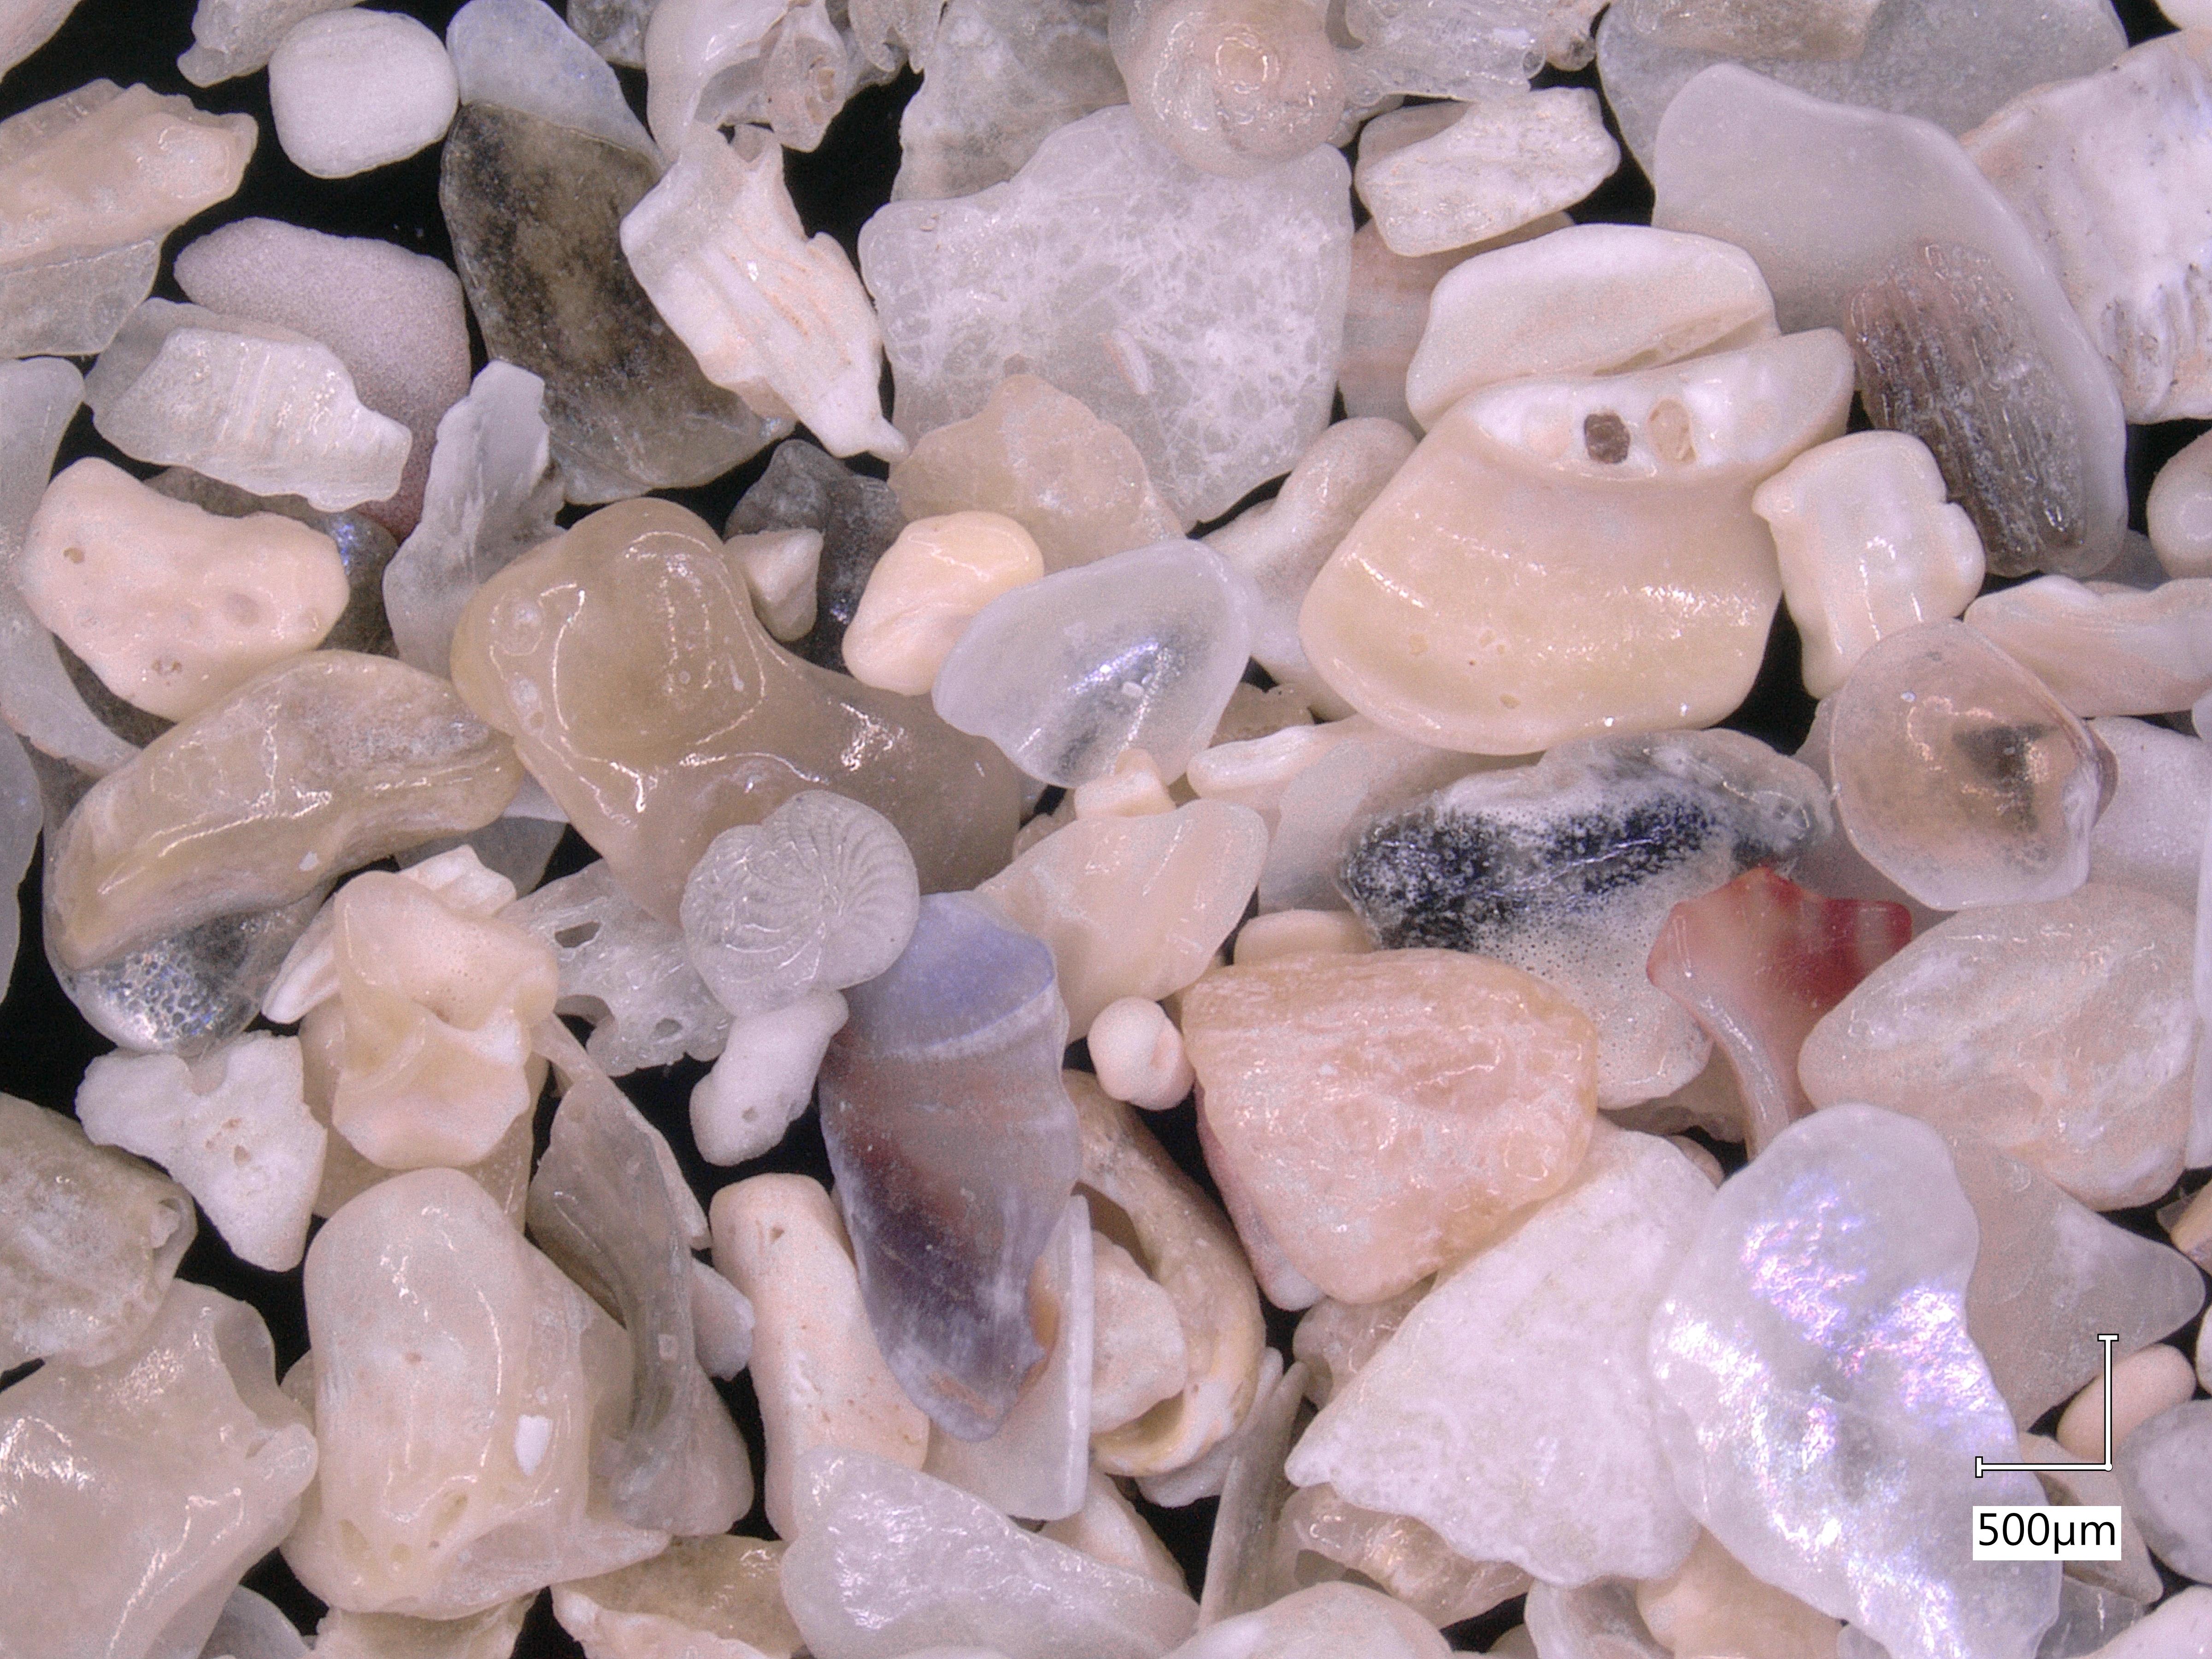
I particularly love the piece in the middle of this photo: it almost looks like a piece of glazed pottery.
I’m really quite curious as to what the red and white fragment in the upper left quadrant is. It looks like a piece of octopus tentacle, although I know it can’t be!
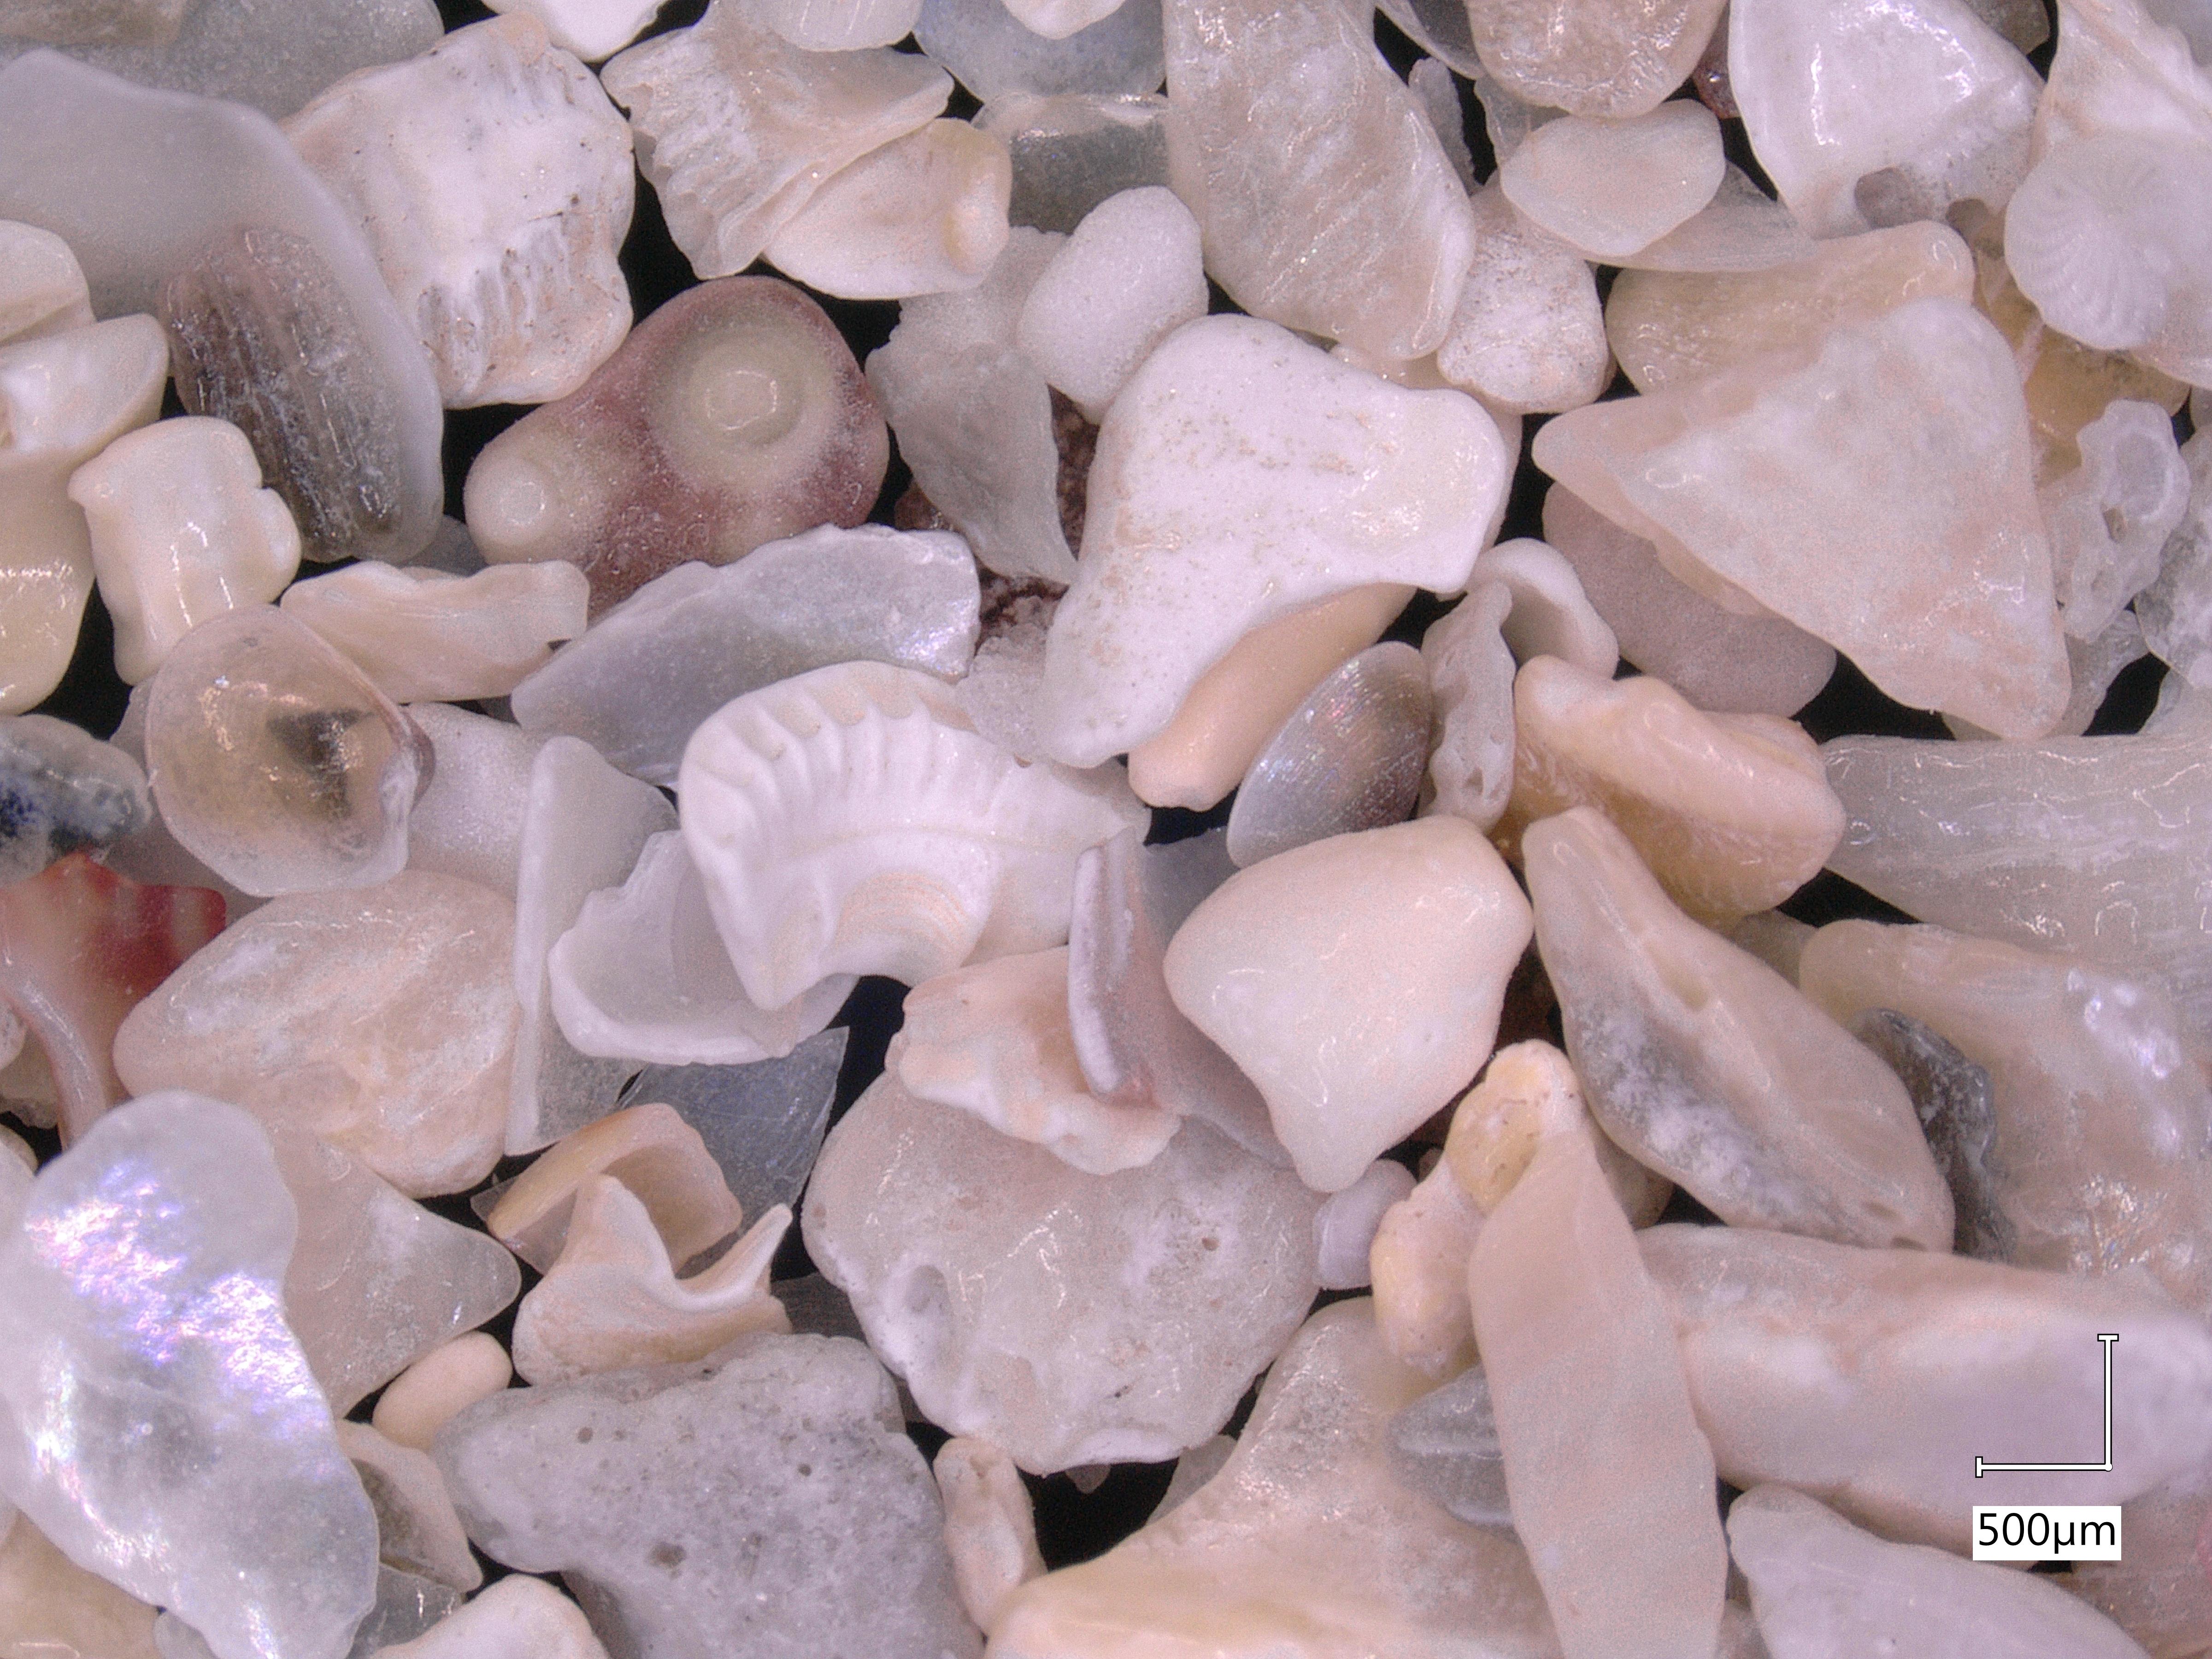
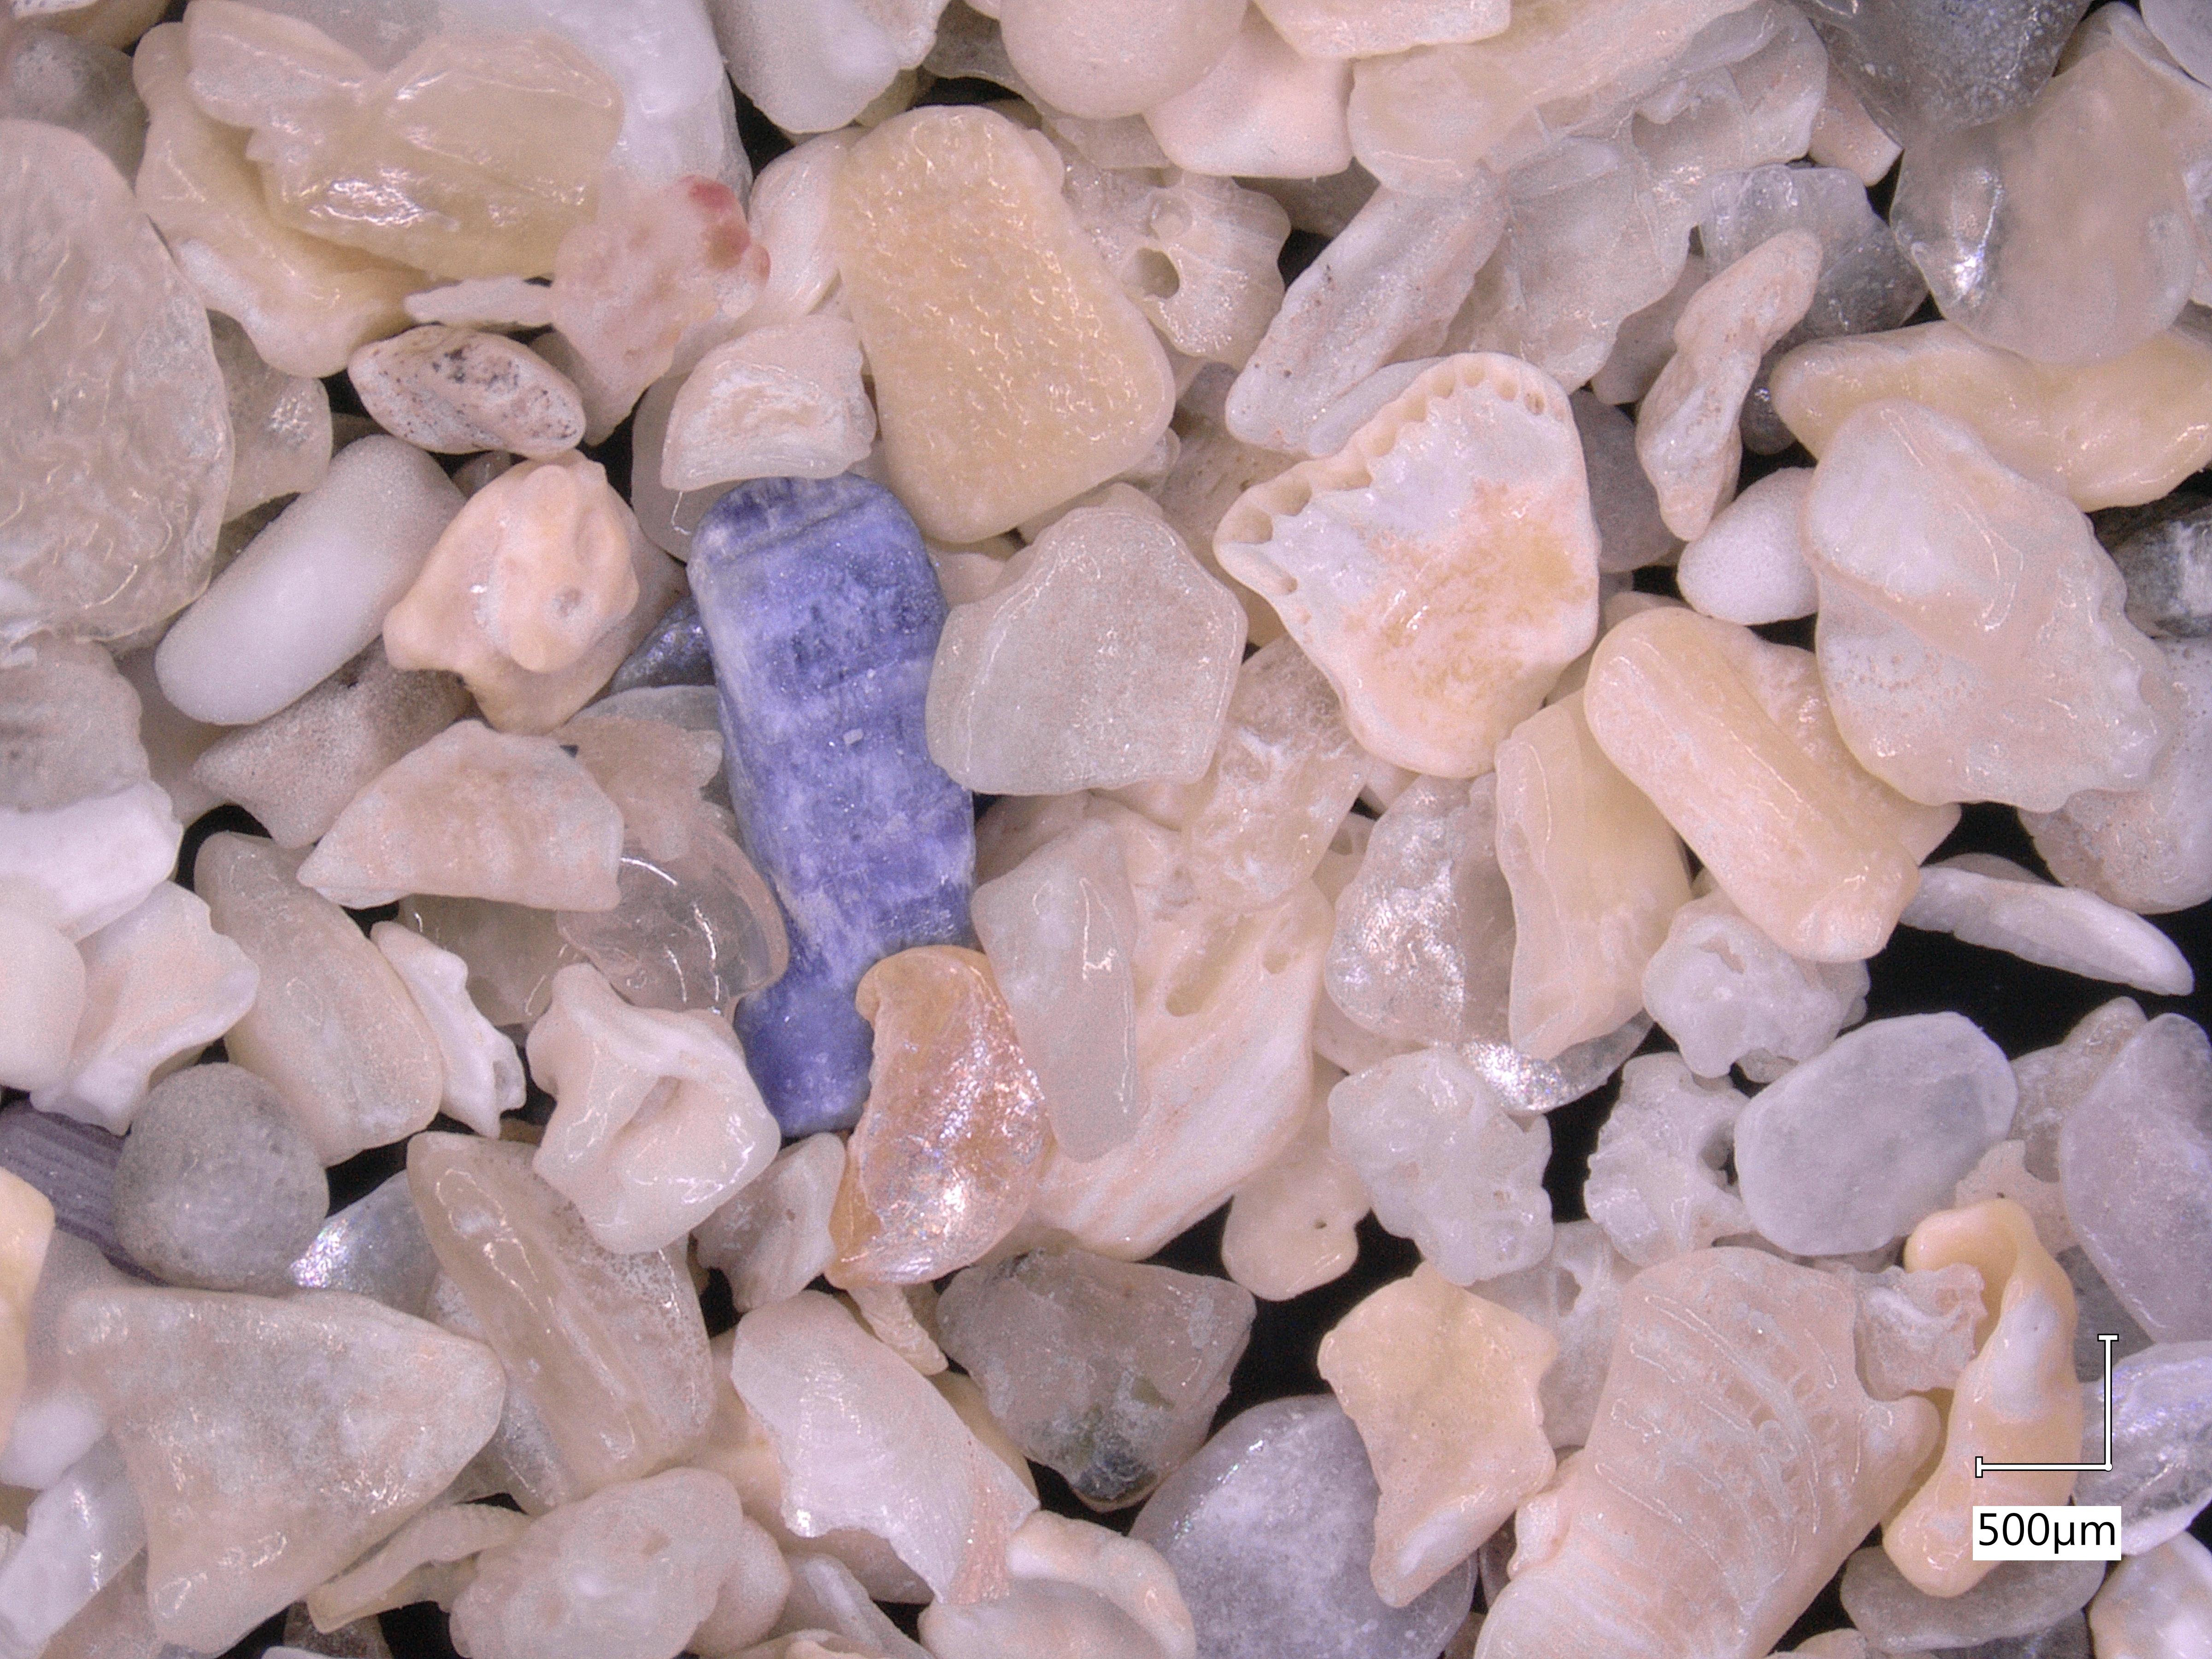
Purple is my favourite colour, so I love the shade of the fragment in the lower left corner. It actually looks a lot like the coralline algae we saw in my photographs of sand from Archipel Glenans. I wonder if something similar is present offshore of Barra… The cylindrical fragment on the right side makes me think of a Roman column.
This one might be favourite- I zoomed in to 40x magnification to take a closer look. The patterns of the white bubbles are beautiful- I am very curious whether that is a shell fragment or actually some sort of igneous rock left over from Scotland’s volcanic days…
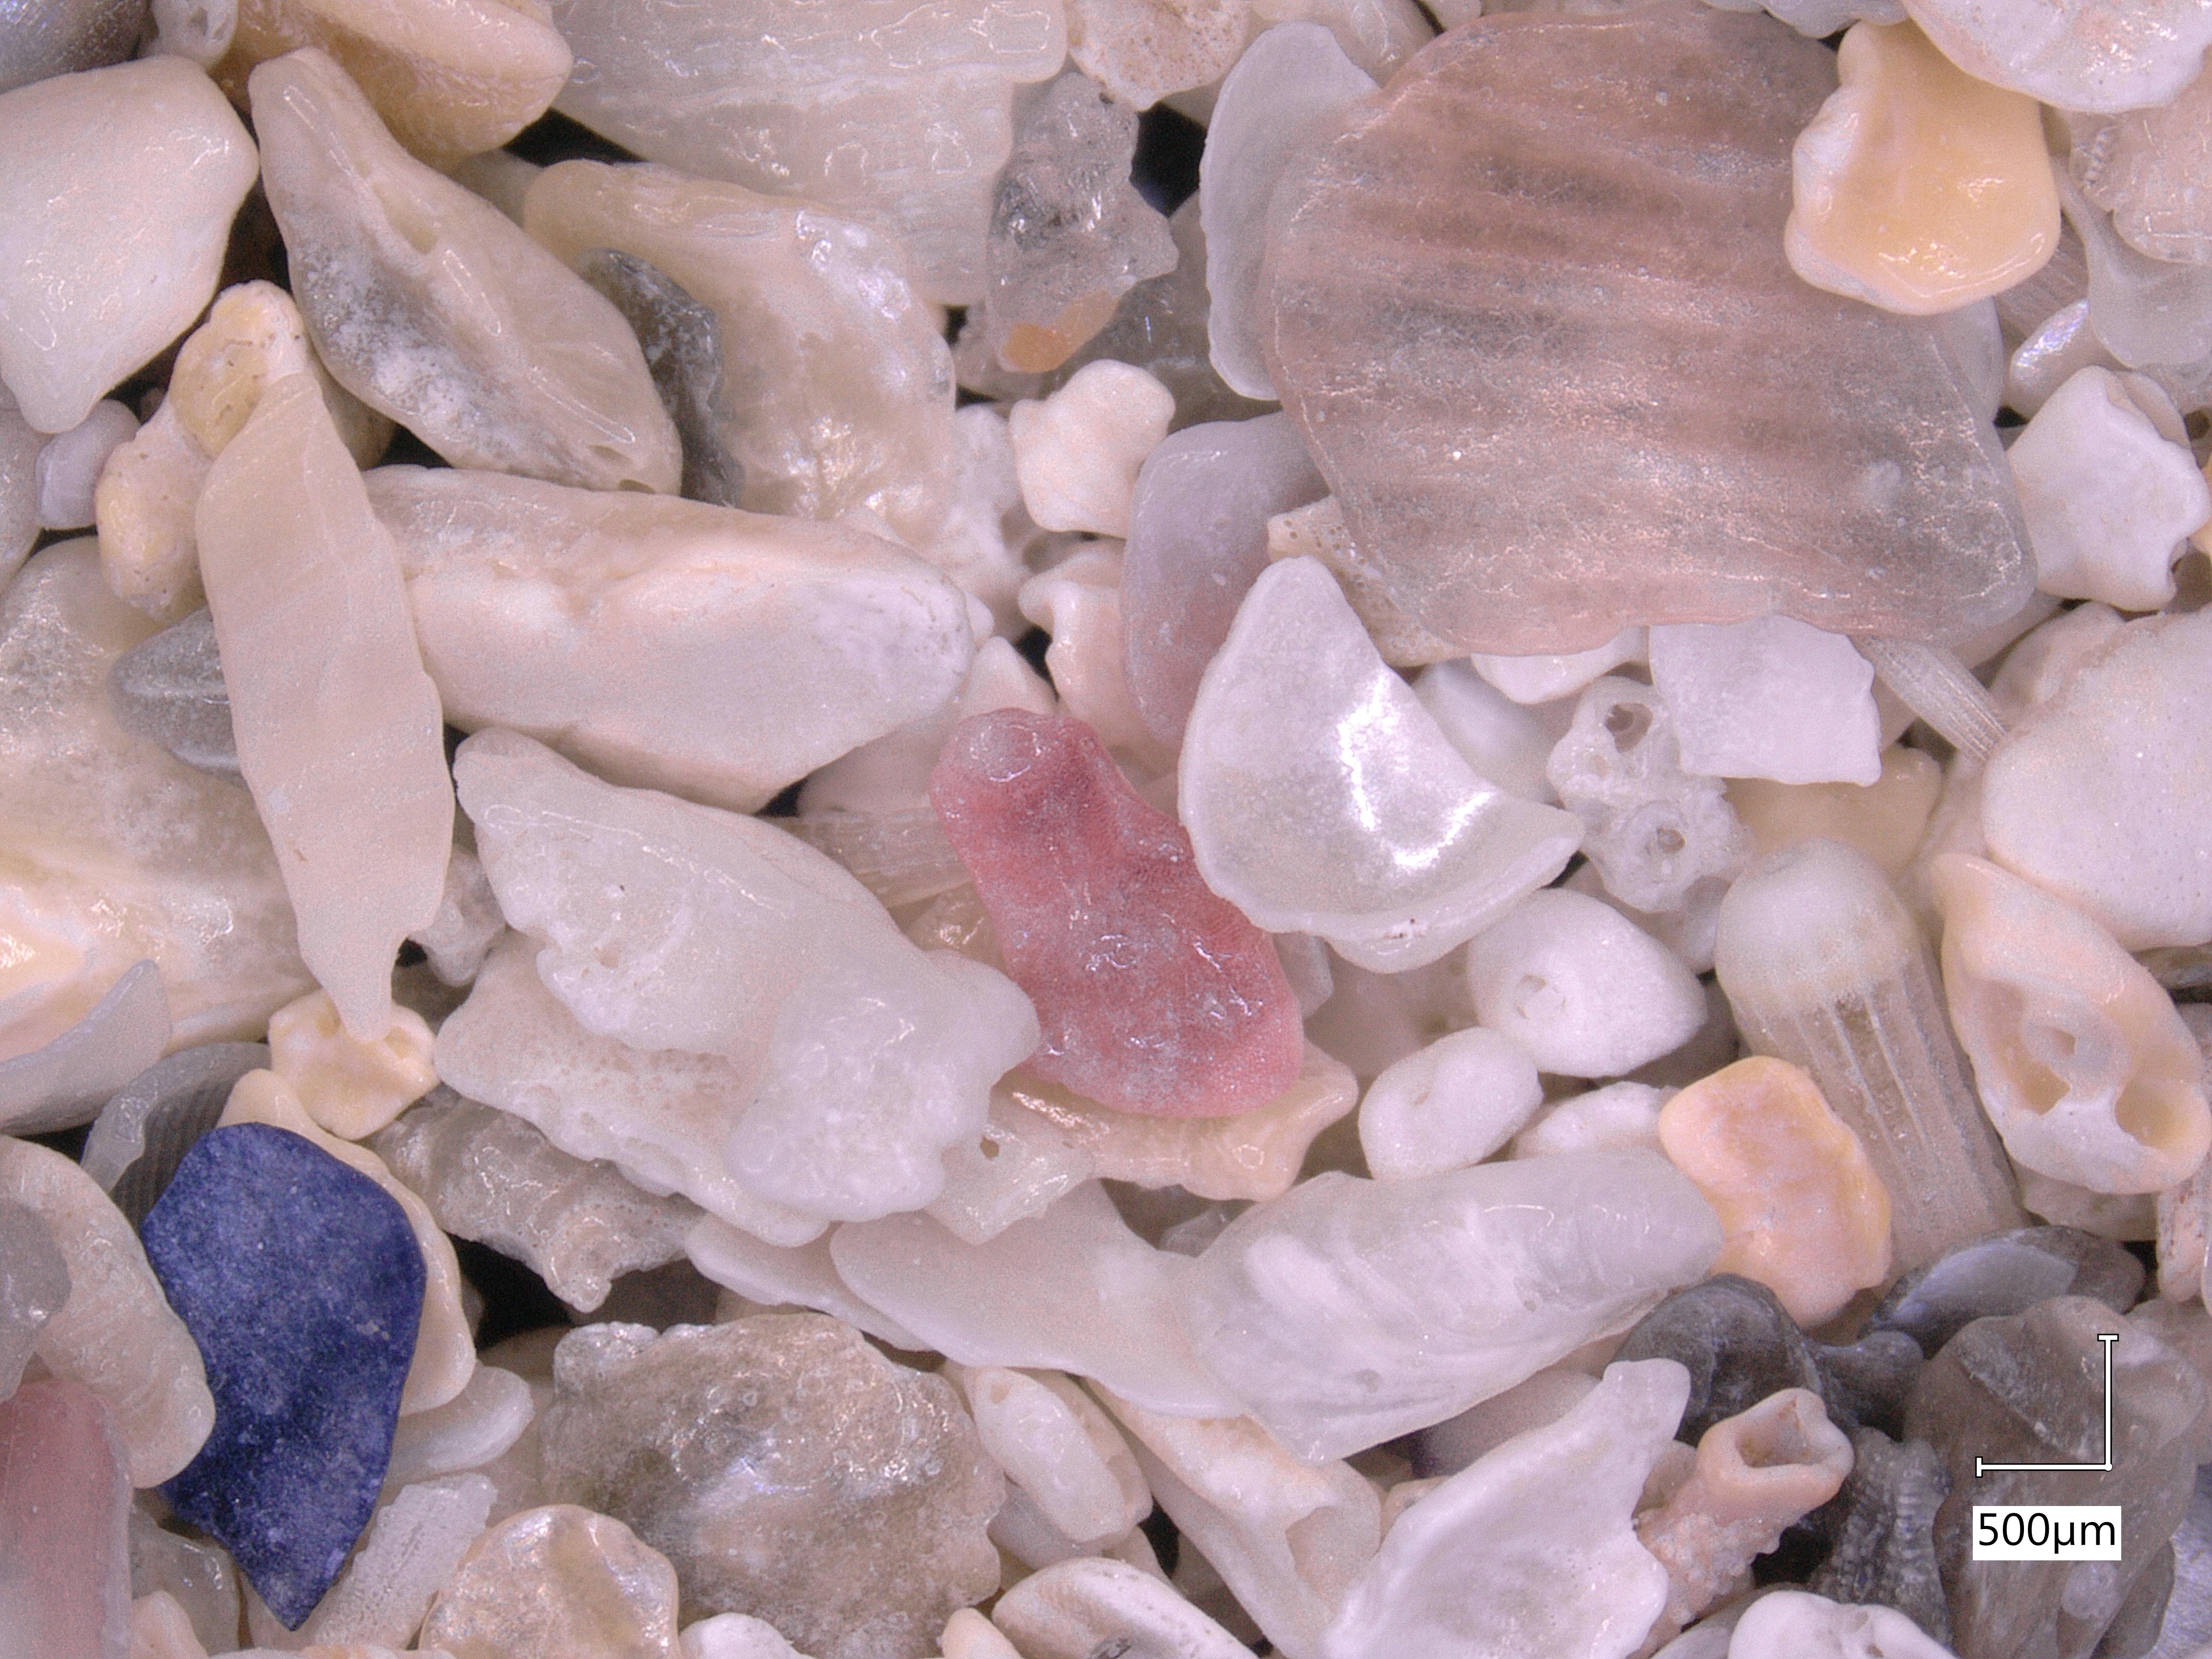
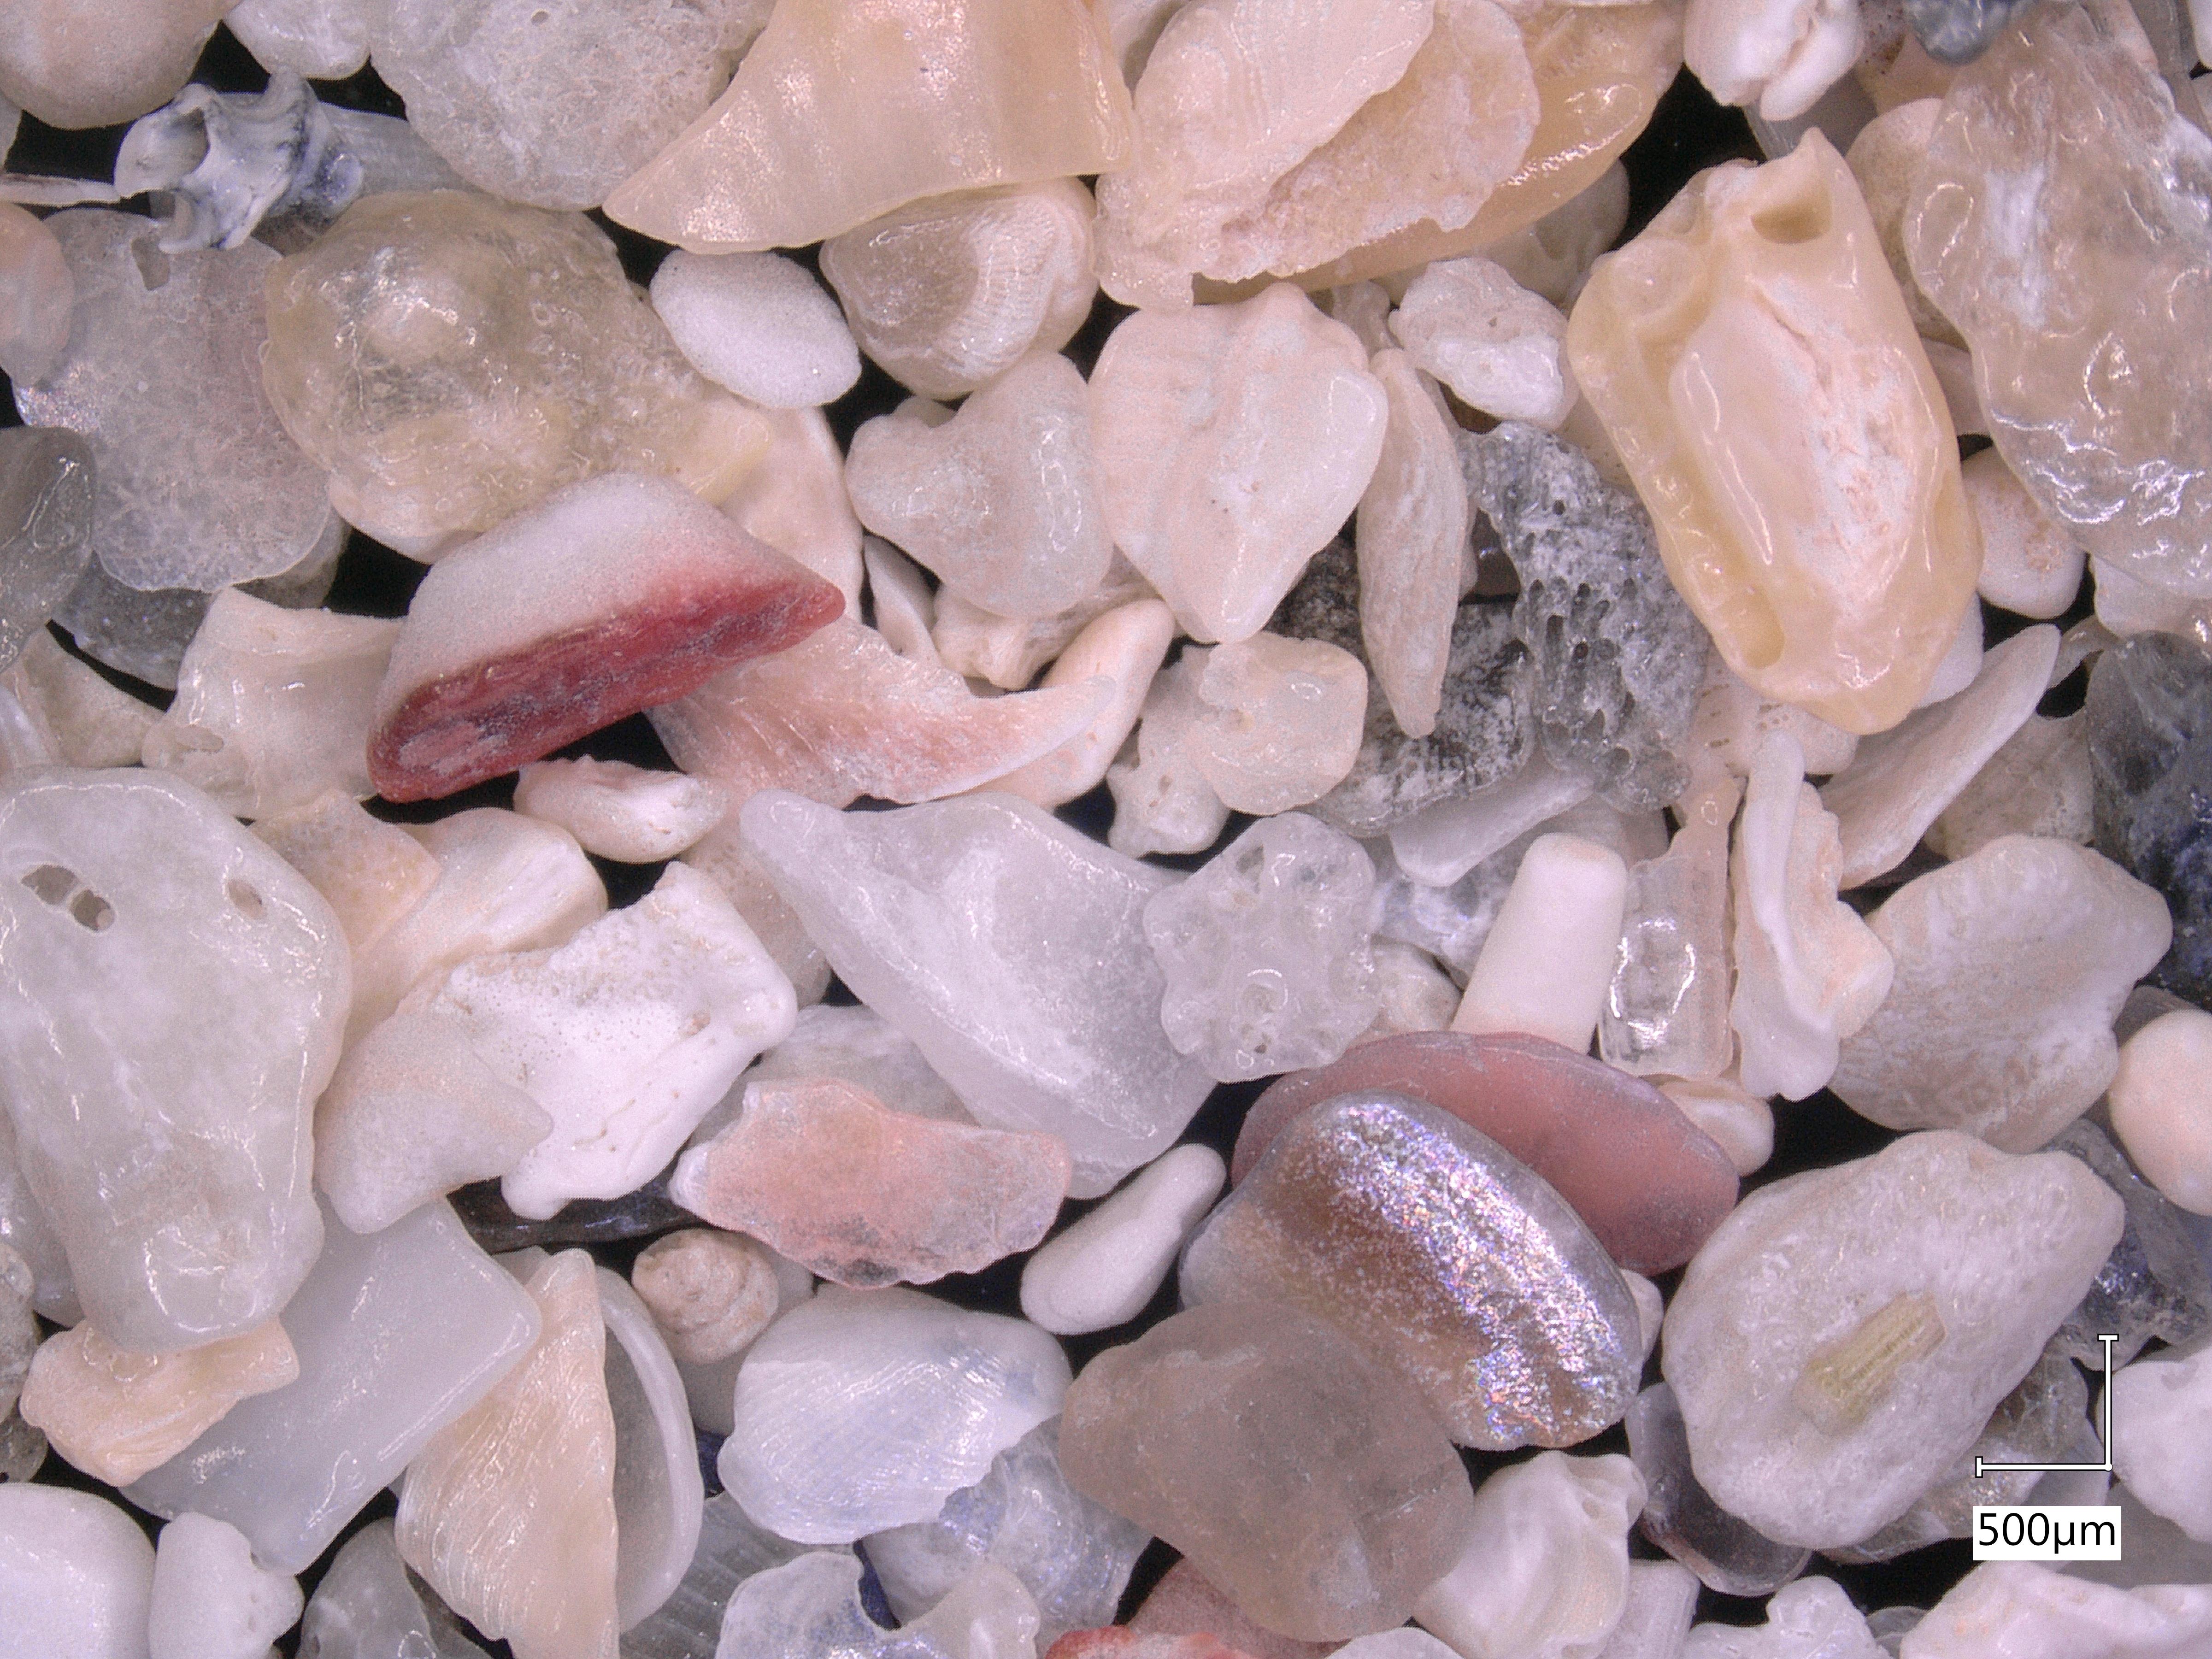
I love the iridescence of the shell at mid-right, and the vivid pink streak in the top left quadrant. So many cool shapes and colours!
I hope you enjoyed those as much as I did. I just wish I knew more about ecology so that I had a better idea of what we were actually seeing here!