In the past few weeks, Vancouver and the BC Lower Mainland have suffered not just one but three record-breaking rainstorms, a succession of ”atmospheric rivers” that dumped several hundred millimetres of rain. Highways washed out and disappeared, and numerous communities were flooded. This resulted in an enormous quantity of sediment reaching the sea via the Fraser and other local rivers. But where exactly does the sediment that’s already in the sea around Vancouver go? How has that changed in the past few hundred years since Europeans colonized the area? To get to the bottom of this, we enlisted Carlijn Meijers.
Last week, Carlijn successfully defended her thesis, ”Sediment transport pathways in Burrard Inlet”. To answer these questions, she created a detailed hydrodynamic and sediment transport model of Burrard Inlet and Georgia Strait in D-Flow FM. She then used the SedTRAILS model that we have developed to visualize sediment transport pathways.
Modelled sediment transport pathways in Burrard Inlet. The red arrows highlight key patterns in the SedTRAILS particle trajectories. Burrard inlet is characterized by strong flows through the narrowest points of the fjord, and large eddies in the wider areas. Source: Meijers (2021).
From these models, Carlijn showed that sediment transport is largely controlled by flow through the First and Second Narrows (where the Lion’s Gate and Ironworker’s Memorial bridges cross). As the tide comes in, the water shoots through these narrow passages at speeds of up to 2 m/s and comes out the far side as a jet, spiraling off into eddies. The tide then goes out and the same happens in reverse, with water shooting out the opposite side.
Conceptual diagram showing the dominant sediment pathways in the Inner Harbour. Source: Meijers (2021).
Due to the sheltered nature of the inlet, waves have only a minor role in sediment transport. However, given the intensity of the tides and the great depths of Burrard Inlet (especially the Indian Arm fjord to the north), most sediment liberated by erosion tends to get carried away from shore and is essentially lost from the coastal sediment budget.
Another key point of her project was to investigate how land use changes and other human effects (e.g., damming rivers, port construction) have changed Burrard Inlet. Using the model, Carlijn showed that these changes to the inlet have shrunken its tidal prism, influencing the currents and sediment transport patterns.
Comparison of the present-day shoreline with the high and low tide lines from 1792, prior to colonization by European settlers. The Second Narrows are so narrow because they were formed by the delta of Seymour River and Lynn Creek. The area has since been dredged and walled off for the construction of the port and to create log booming grounds. Source: Meijers (2021).
These changes are especially evident when we compare satellite photos from the present day with the oldest available images from the 1940s.
Second Narrows in the 1940s and 2021. Please forgive my crappy georeferencing, I eyeballed it. Source: City of Vancouver and Google Earth.
Carlijn wrote an excellent report and capped it all off with one of the best master’s thesis defenses that I’ve seen in a long while. She also handled the cultural context of the project with great respect, interest, and sensitivity. If anyone reading this is looking to recruit a new engineer/researcher with heaps of potential, I cannot recommend Carlijn enough.
All in all, this was a fascinating project and one very close to my heart — I was born in the Vancouver area and was excited to see how the SedTRAILS model could be used in my original backyard. Let’s keep the Delft-Vancouvercollaborations going!
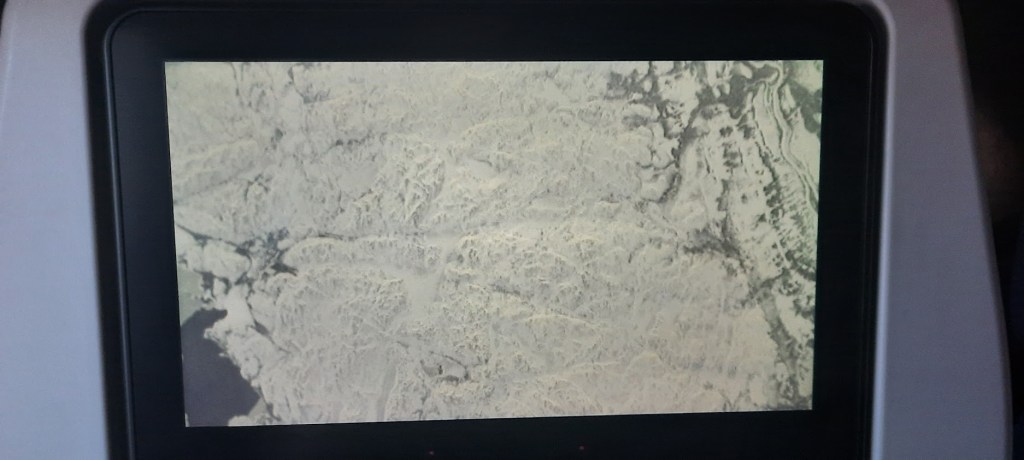
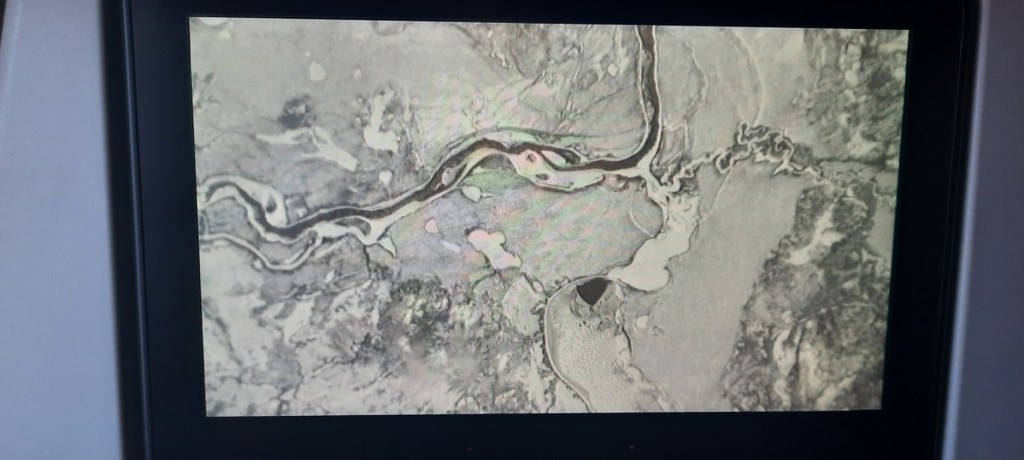
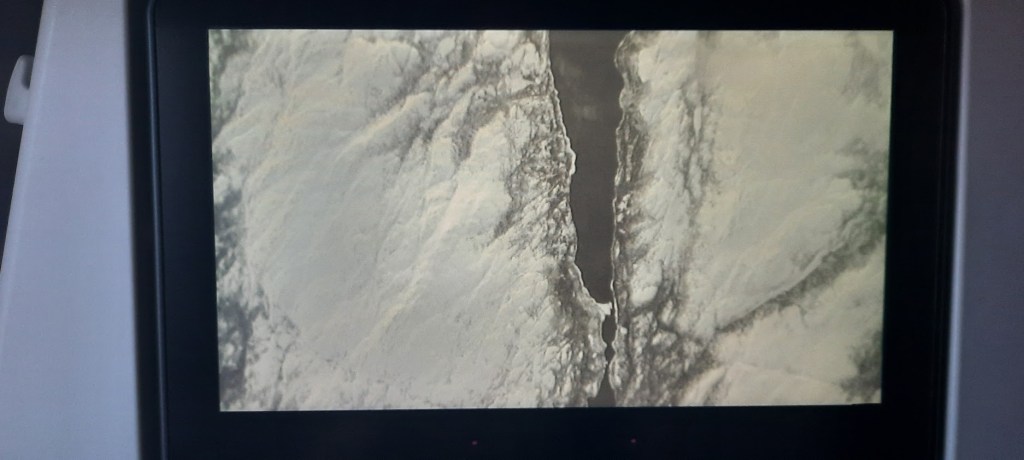
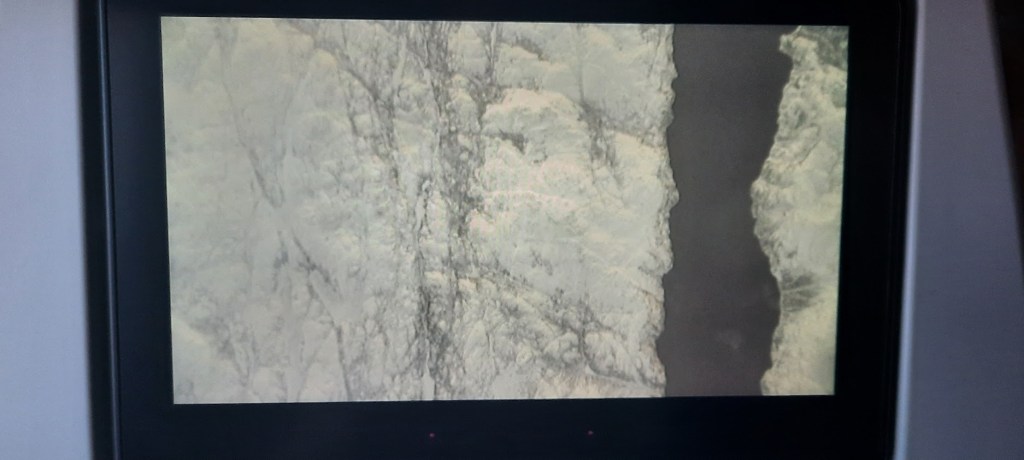
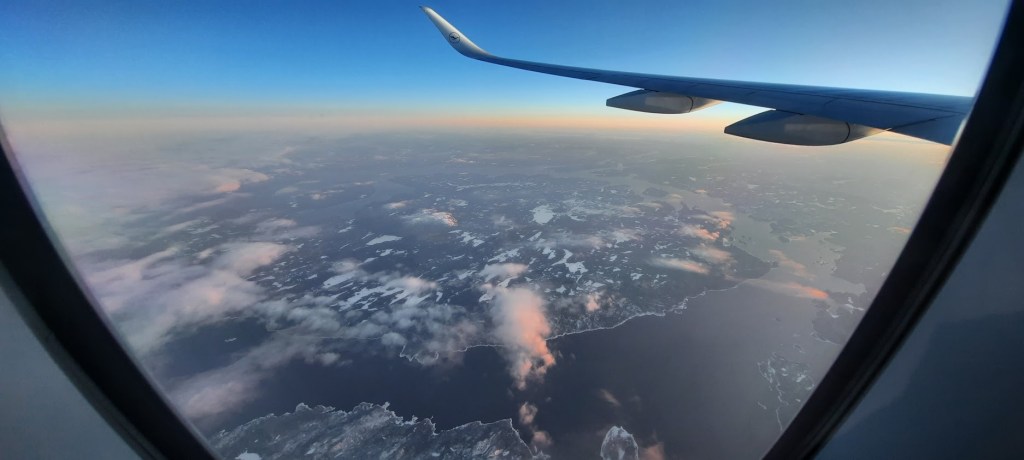
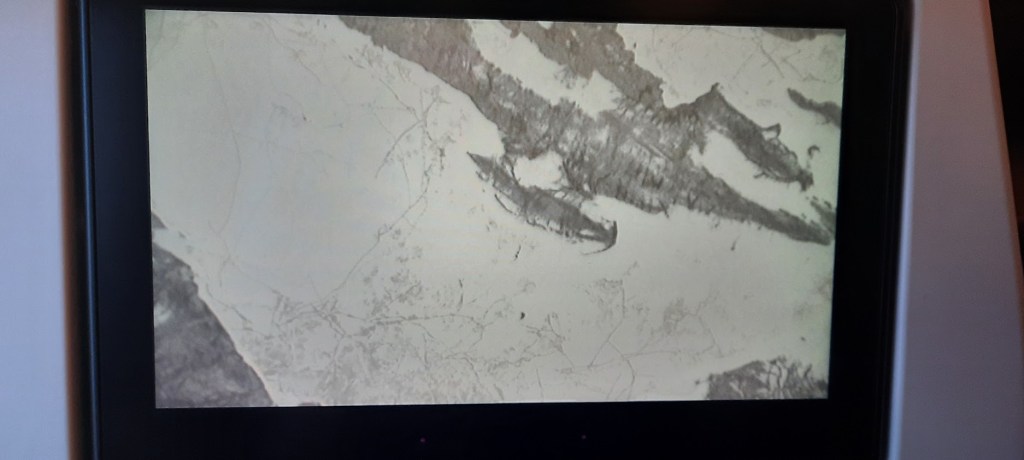
Yesterday, I flew home to Toronto from the Netherlands, after handing in my PhD thesis. The plane had a camera pointing straight down that you could watch via the screens mounted in each seat. We had clear skies coming in over Labrador, and I spent the next two hours staring at the ground ten kilometers below. I normally take a window seat when I fly back, but this time felt like a new way of seeing Canada, a sort of involuntary real-time scroll through Google Earth. These words jumped out at me like popcorn and I thought I would share them.
What if it got so cold That it snowed every day For a thousand years?
So much snow That it piled up in drifts Three kilometers high
And flowed out Like pancake batter Across a precambrian griddle
Milling old mountaintops Into flour Our collective geologic trauma
Ten million fjords All pointing Into the sunset
Through Caravaggio clouds Unfurling roses Obscuring violence
Scars revealed By reservoirs Cursed news from another star
Windblown white floes Serrate inky lakes Like polished granite
Black spruce Persisting through Their boreal blankets
Leopard stripes And zebra spots On a gneiss throw rug
But then a road Too straight for this fractal tapestry Points home
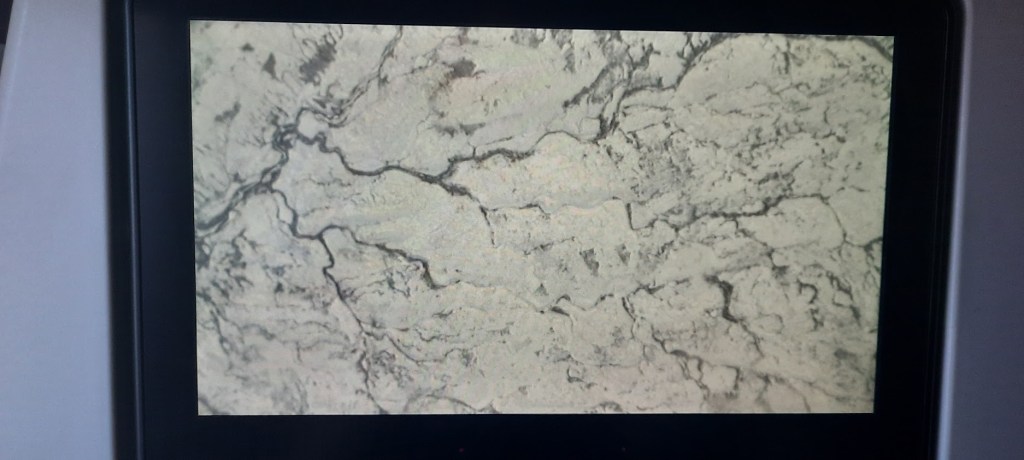
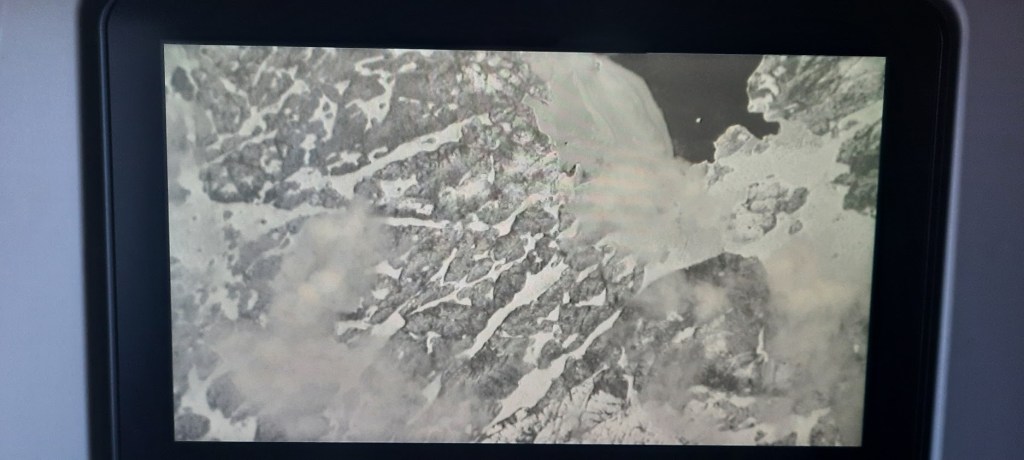
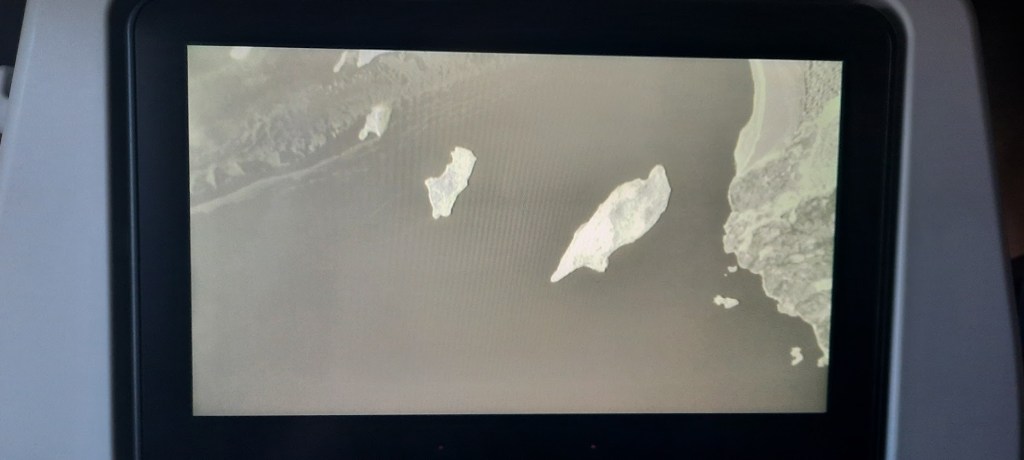
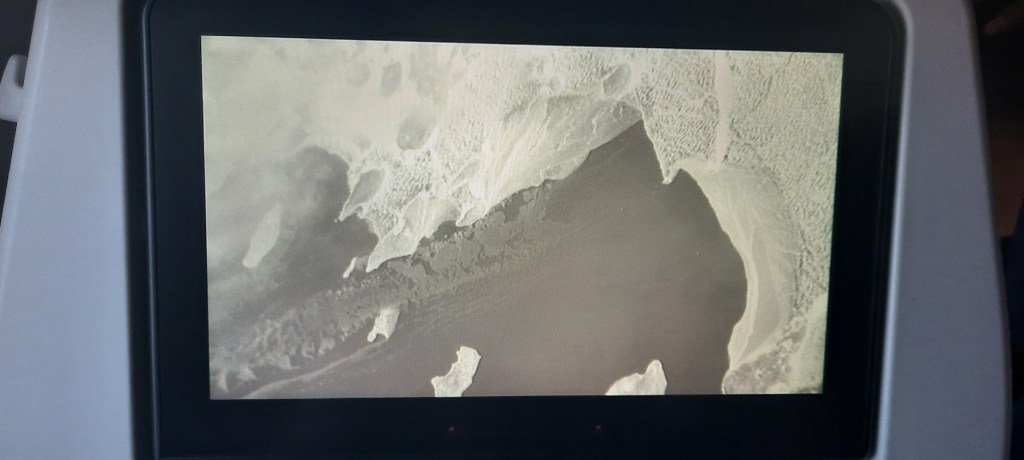
Here are some photos; the resolution and clarity obviously don’t do the view justice, so the poem is my humble attempt to capture some of what I saw.
Today is Liberation Day in the Netherlands, and marks the 75th anniversary of their liberation at the end of World War II. There were many Canadians involved in that operation, so today is often marked by celebrations of Dutch-Canadian friendship on both sides of the Atlantic. Since I can’t actually celebrate anything with my Dutch friends these days, I instead offer up this poem:
Due to my non-Dutch upbringin’
I can’t speak the language they sing in
So I took a Dutch course
Now I make my voice hoarse
As I try to pronounce Scheveningen
I really need help with my Dutch
Since I currently lack the right touch
I don’t mean to sound terse
But I just can’t converse
Though I like writing poems very much!
Your regularly-scheduled coastal science and engineering-themed blog posts will resume… eventually…
A few weeks ago, I was reading a book about glaciology recently when a sentence caught my eye. Many advances in our understanding of how glaciers developed and transformed our world during the last ice age came from studying the Canadian landscape. In particular:
A benchmark example [of paleo ice sheet reconstruction] was the compilation of the first Glacial Map of Canada in 1959, followed by its update in 1968, by the Geological Survey of Canada, based on painstaking aerial photograph and field mapping by its officers on a map sheet by map sheet basis after the completion of the aerial photograph coverage for the whole country in the 1950s.
This caught my eye, because I knew that my Grandpa on my Dad’s side of the family was a pilot who flew a lot of aerial surveys for the Canadian government in the late 50s. I mentioned this to my Dad, just thinking he’d say, “gee, that’s cool”, and move on. Apparently that triggered something in him though, because a few days later my email inbox was filled with a treasure trove of old family photos that I had never seen before. In recent years I have also developed an interest in Arctic coastal geomorphology, so this discovery scratched a couple of itches for me.
One of the photos was taken above Alexandra Fjord on Ellesmere Island, which is insanely far north (78°N!):
Alexandra Fjord, Ellesmere Island. Photo copyright B.G. Pearson.
The cool thing is that when I went into Google Earth, I was able to snoop around and actually to find the same vantage point. To my surprise, it seems like the glaciers there haven’t changed much since my grandfather was there in 1957:
Alexandra Fjord today, seen in Google Earth.
However, Dad pointed out that perhaps the glacier at the front hasn’t changed, but that the ice field behind it has shrunk. He probably has a point there…
So pristine! Photo copyright B.G. Pearson.
My Grandpa’s airplane on the right hand side. Photo copyright B.G. Pearson.
Why was he actually up there, and what were they surveying? A series of radar transponders were set up across northern Canada so that the airplanes could precisely triangulate their positions . Based out of Ottawa, my Grandpa and his colleagues carried out many long flights between remote destinations A newspaper article from 1957 describes the tremendous undertaking that mapping the entire Canadian Arctic was, apparently the world’s most ambitious aerial survey operation at the time:
“SEVEN-YEAR JOB: Rockcliffe Squadron to Complete Mapping
Monday, March 25, 1957
“Planes from the RCAF’s 408 Photo Squadron at Rockcliffe Airport will fly to within 450 miles of the North Pole this Spring to complete the geodetic survey of Canada which it started seven years ago.”
“Using the huge USAF base at Thule, Greenland, and RCAF’s own base at Resolute Bay, both well within the Arctic Circle, the planes will criss-cross approximately 400,000 square miles of Arctic wasteland to produce reference points for the accurate mapping of Canada.”
“This year’s aerial mapping mileage will bring over 3,000,000 square miles – approximately 90 percent – of Canadian territory accurately surveyed by the Air Force. When the 300 men of the squadron return to base here about July 1, they will have completed the world’s greatest aerial survey operation.”
Survey points in the Canadian Arctic from the 1950s. My Grandpa flew some of the northernmost missions.
While the mapping operation may have been motivated by a Cold War-era push to map Canada’s north for defense purposes, the operation was also of great scientific benefit. In addition to providing a wealth of useful data for glaciologists, the measurements also provided important insights into other fundamental geophysical questions. For instance, the earth is not a sphere, but rather an oblate spheroid, or something like a squashed rugby ball. But even then, gravity is weird and complicated, so the rugby ball comparison only takes you so far, and precise measurements are necessary to figure out all of the actual irregularities in Earth’s shape.
Measurements like these have many applications, including for estimating sea level rise rates. By understanding how the Canadian Arctic is rebounding in response to deglaciation, scientists can better answer Tricky Questions About Sea Level Rise there.
One of my favourite stories from the 1957 article involved some of the corrections that were made to previous maps:
“Throughout the … programme, many positions believed to be accurate were found to be in error. In 1956, for example, Prince of Wales Island (in which the North Magnetic Pole was then located) was found to be three miles further south than was indicated on the map.”
“Although they didn’t possess any supernatural strength to move mountains, from such discoveries as this, the members of the 408 Photographic Squadron did, facetiously, claim the ability to move islands.”
I would thus like to think that all my researchon islands is simply carrying on a Pearson family tradition! My Dad (a civil engineer) also worked in the Arctic during the 1980s, constructing artificial islands in the Beaufort Sea. That’s a story for another time, though!
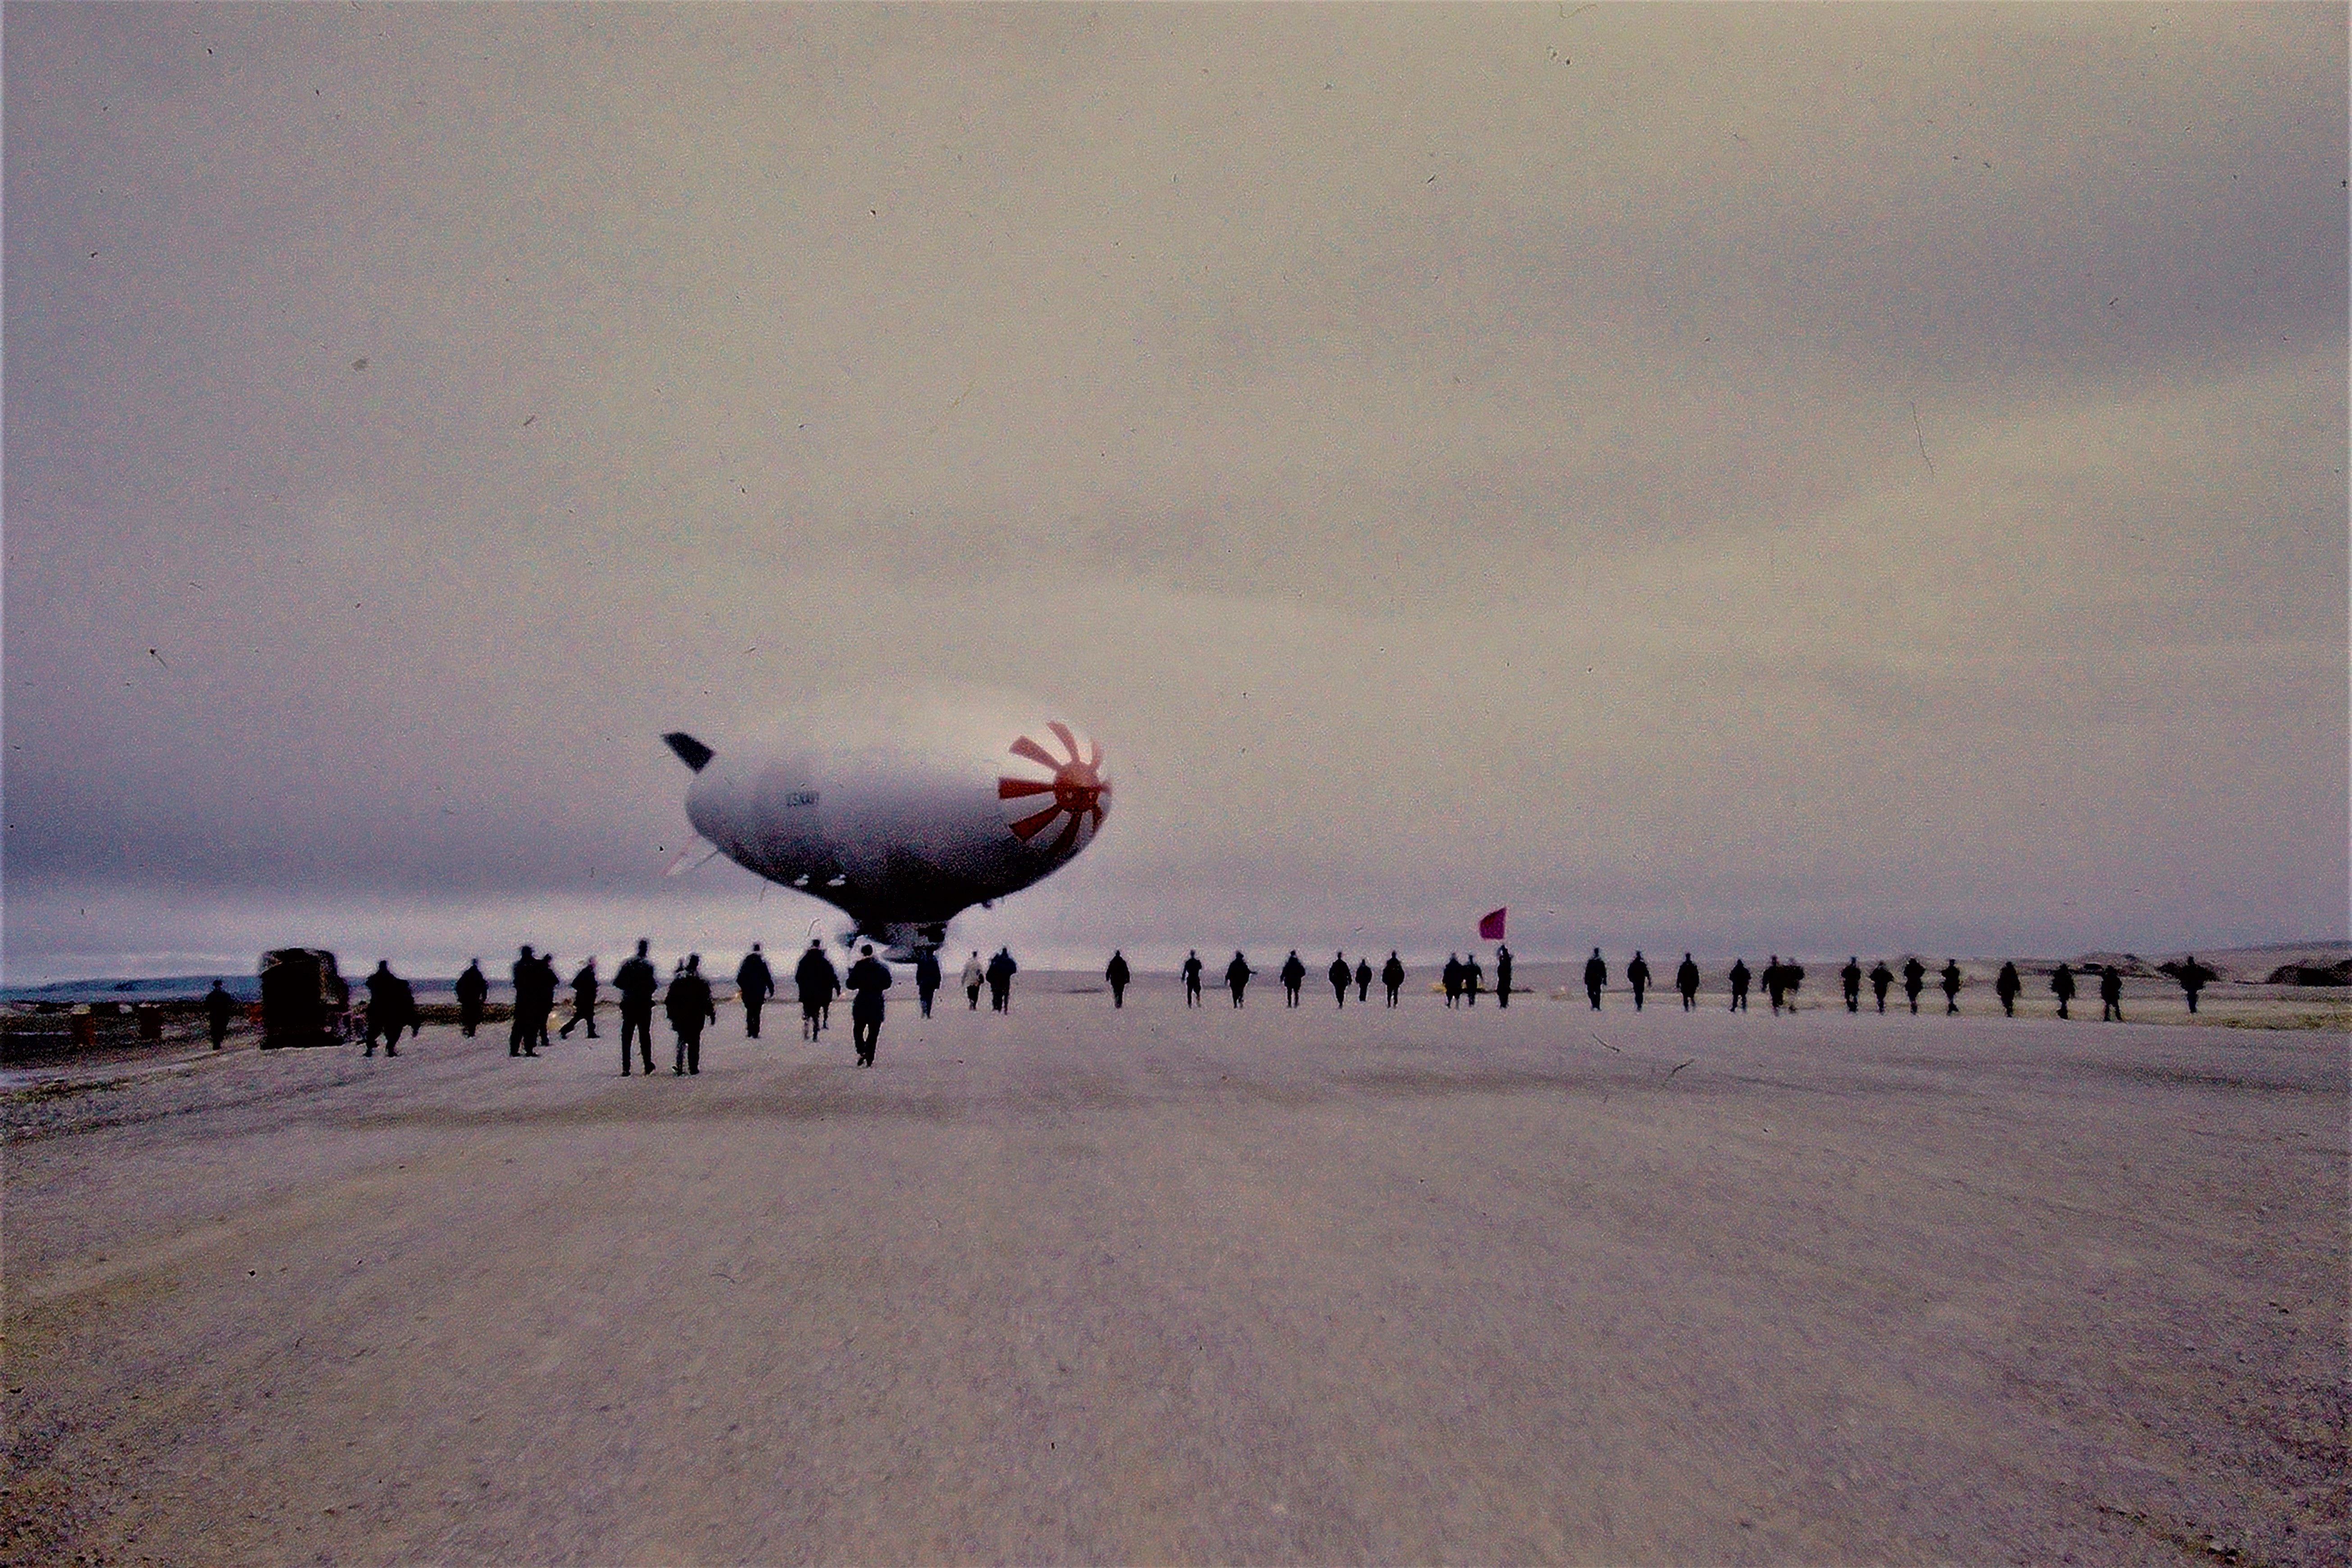
Speaking of Pearson family traditions, I can see that my Grandpa also had a clear eye for photographic composition, a gift that my Dad quite strongly inherited:
Airship on some remote runway in the far Canadian north. Photo copyright B.G. Pearson.
Another reasons I was so delighted by these photos is because one of my favourite painters, Lawren Harris, also spent a lot of time in the Canadian Arctic. I have always felt drawn to his dramatic mountain landscapes capped with snow, and nary a tree for thousands of miles. The mountains of the far north have a particular shape to them, which seems unique compared to most of the mountains I have seen with my own eyes.
Mount Thule, Bylot Island, by Lawren Harris, one of my favourite painters. He had a very unique view of the same Arctic landscapes my Grandpa used to fly over.
I made it as far north as Lofoten in Norway (68°N), and have flown over parts of the Arctic on transatlantic summer flights, but have never actually set foot on those rugged and remote hills. Something for my bucket list!
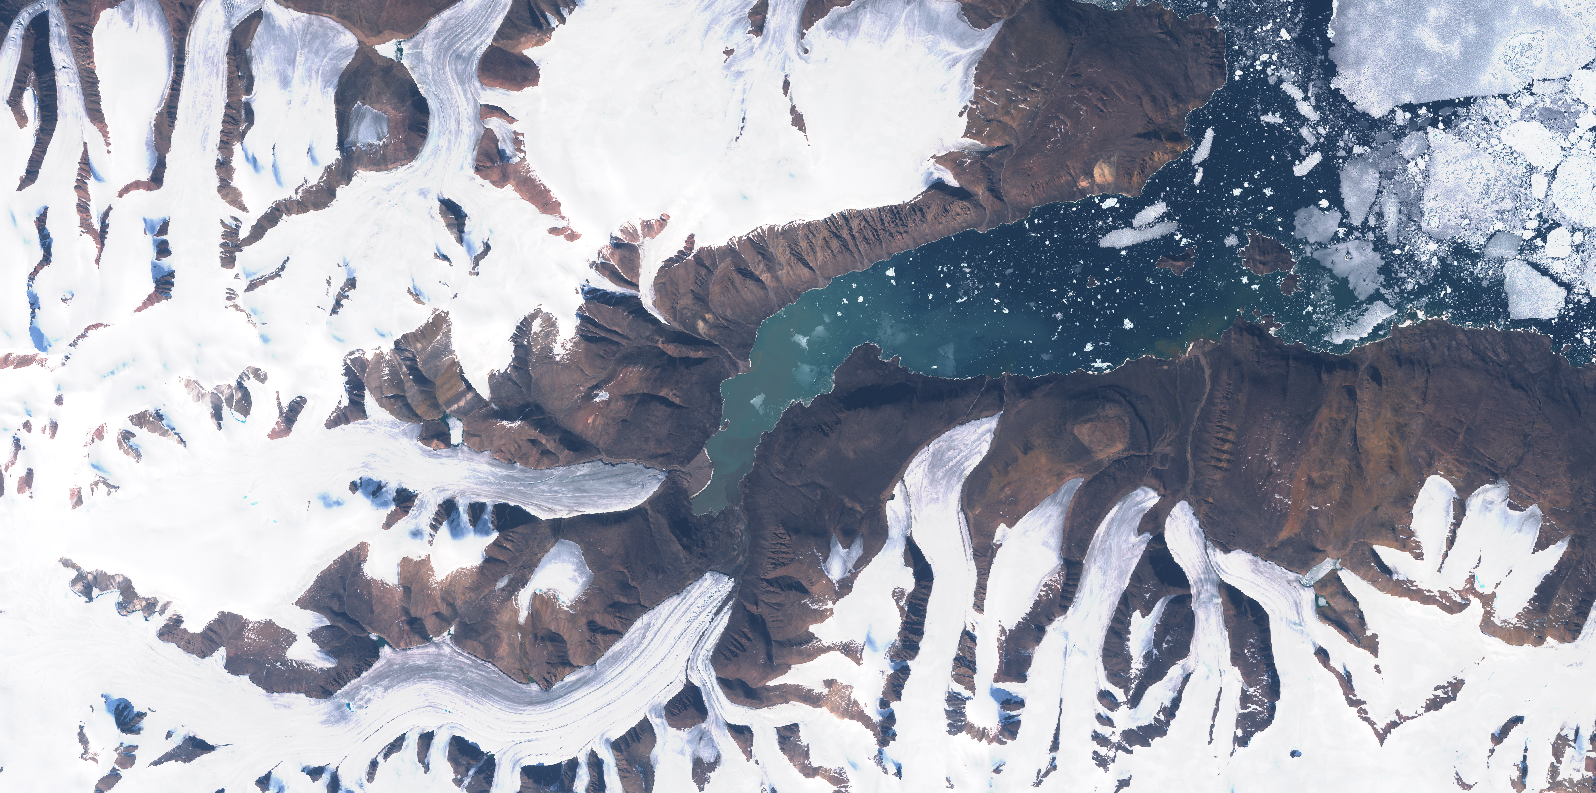
One more of Alexandra Fjord from space, because I can’t get enough of the staggering beauty of these landscapes. [Source: Sentinel 2 L1C on July 17, 2019]
Vancouver holds a special place in my heart. I was born out there, and even though we moved away when I was very young, it has continued to re-emerge in my life. In 2011, I moved out there after a difficult breakup and the city breathed new life back into me. While there, I discovered a new vocation in hydraulic modelling for predicting floods, something that I am still doing to this day. I have returned to Vancouver a number of times since then, since my brother and a surprising number of my closest friends have ended up out there. I hope to return this September for a wedding!
Coal Harbour, Vancouver.
One of my favourite parts of Vancouver is walking its coastline. The city was built on the edge of a large fjord, but has a variety of coastal landscapes, from towering cliffs to sandy beaches, mud flats to salt marshes, and of course a number of urbanized shorelines.
Even though I am in the Netherlands now, I am trying to keep my Vancouver connection alive through my work. Last year, I co-supervised a fantastic group of TU Delft students who worked with Kerr Wood Leidal and the University of British Columbia (UBC) to investigate the erosion of the Point Grey cliffs, on which UBC is situated.
Eroding cliffs of Point Grey. The University of British Columbia is at the top of the cliff, so naturally they are concerned with understanding the rate of erosion and means of slowing it.
The project was an interesting one, as the students (representing three different countries) tried to bring their lessons learned about Dutch coastal engineering to Canada. Canadian coastal zone management is much more fragmented than in the Netherlands, where everything is more or less centrally controlled by the federal government. The entire Dutch coastline is also incredibly well-monitored, with high resolution bathymetry taken every few years, and with countless other measurements available. Acquiring the data necessary to perform a coastal engineering study in Vancouver required contacting dozens of different sources and dealing with numerous agencies at multiple levels of government.
Sand from Wreck Beach. It is quite coarse and angular in shape, and the green and red tints are quite nice. Being glacial in origin, these sand grains have likely been bulldozed by ice or carried by meltwater from far and wide. This accounts for the variety of particles we see.
In the end, the students looked at a number of possible solutions for slowing the coastal retreat, including sand nourishments and revetments. One of the most intriguing concepts that they explored was the idea of a clam garden, a traditional approach from the First Nations people living on the BC coastline. Originally intended for aquaculture, clam gardens are usually small rock walls placed along gravel beaches, behind which where clam-friendly sand or mud can accumulate. However, this approach could have added benefits for coastal protection by attenuating waves and encouraging the deposition of sediment. In many ways, it is not that different from the Dutch using brushwood dams to reclaim land in the Netherlands or my colleagues using similar structures to rebuild mangrove habitats.
In Canada, the involvement of First Nations in coastal planning is becoming increasingly important (as I think it should be!), and there is a lot that science and engineering can benefit from their traditional forms of knowledge and experience. Building with nature instead of fighting against it has recently become a popular design philosophy in coastal engineering, and who better to have as allies in that task than the people who have been living with and building with nature already for centuries?
World War II-era bunker on Wreck Beach overlooking the Georgia Strait, with North Vancouver in the background.
The Delft-Vancouver connection continues: right now we have a group of five students investigating coastal protection solutions with Kerr Wood Leidal and the Tsleil-Waututh Nation. They have already been out there for a month, and I am excited to see what they come up with!
Sunset over the Spanish Banks, just around the corner from UBC.
Last week, the Newfoundland (on the east coast of Canada) got hit by a record-breaking storm: a “hurricane blizzard”, with 150 km/h winds, >10 m waves, and almost a metre of snow. Newfoundlanders are no strangers to bad weather, but this is rough stuff even by their standards.
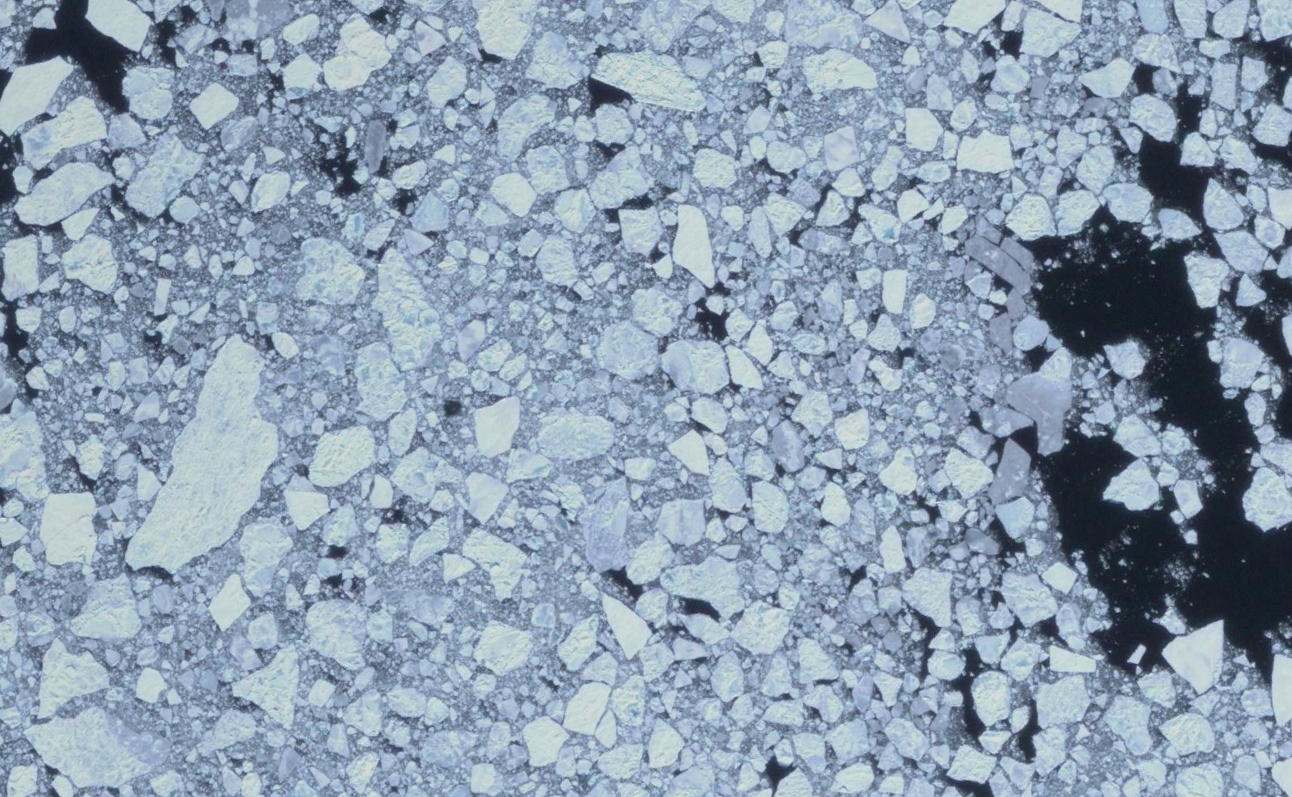
In a fit of procrastination, I started wandering around Newfoundland in Google Earth. The Strait of Belle Isle separates the northern tip of Newfoundland from the rest of Canada, and is often frozen over in the winter. When this ice breaks up in the spring, it makes beautiful patterns from space. What struck me was that the broken ice floes looked a lot like the microscopic sand photographs I have been posting on this website:
Ice floes in the Strait of Belle Isle, Newfoundland on April 22, 2015. For scale, the big floe on the left is 150 m across its longest axis.
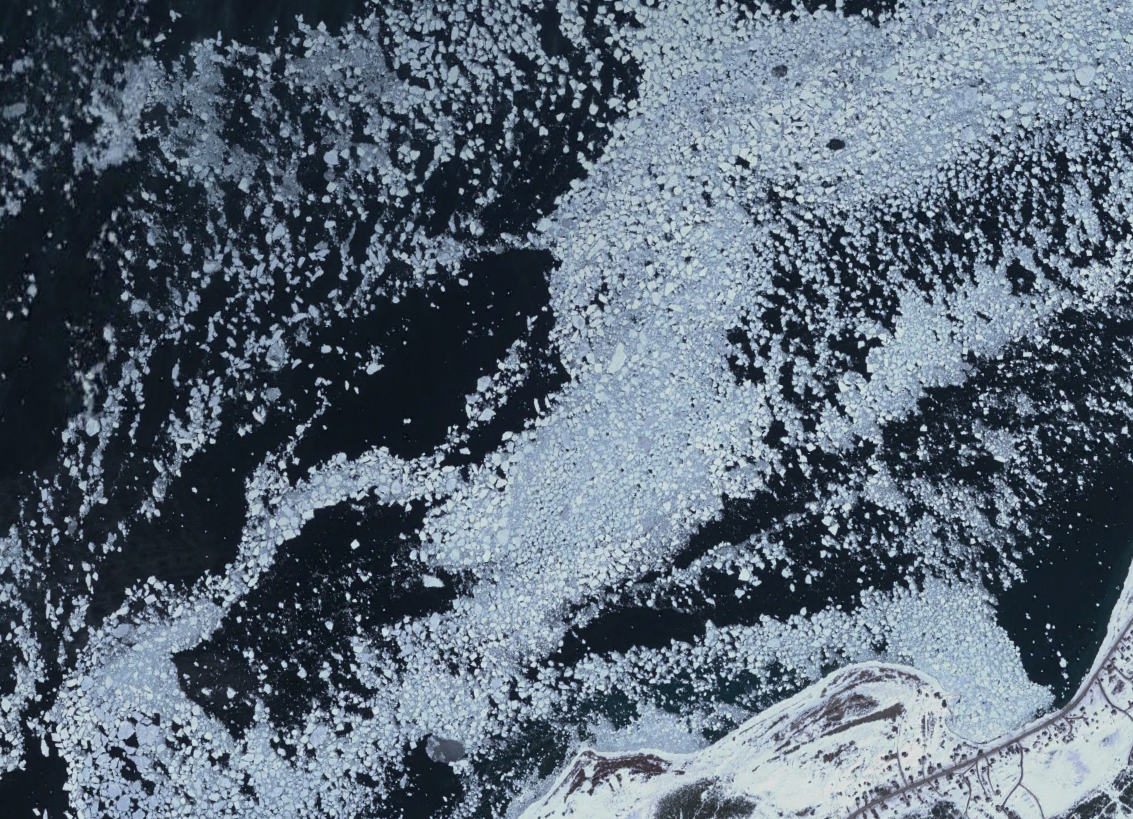
When you zoom out a bit further you can start to see larger patterns that appear to be formed by different flows shearing past one another. For scale, look at the 150 m-long floe in the middle (which we saw in the previous photo).
Apparently the shape and size of sea ice floes is largely governed by ice melting, collisions and mergers between floes, and breakup due to flexing by ocean swell waves (Toyota et al., 2006). Even though the specifics of the mechanisms moving and shaping sand grains on the seabed at millimetre scales are different from those acting on ice floes one million times larger, the same general laws of physics still apply. This is one of my favourite things about nature: there is great beauty in finding similar patterns at different scales in completely different contexts!


