

Many of the world’s idyllic tropical coasts are facing threats on multiple fronts. Rising seas threaten the very habitability of many low-lying islands, and the coral reefs that often defend these coasts from wave attack are dying, too. Compounding this problem is the sheer number and variety of these islands: there are thousands of islands, and the coral reefs surrounding them come in all shapes and sizes. Located around the globe, these islands are each exposed to a unique wave climate and range of sea level conditions. This variability in reef characteristics and hydrodynamic forcing makes it a big challenge to forecast how waves will respond when they approach the shore, something that is quite tricky even at the best of times. Under these circumstances, how can we protect vulnerable coastal communities on coral reef coasts from wave-driven flooding?
This is the problem that our fantastic former student, Fred Scott (now at Baird & Associates in Canada), tackled in his paper, Hydro-Morphological Characterization of Coral Reefs for Wave Runup Prediction, recently published in Frontiers in Marine Science. Working in partnership with Deltares and the US Geological Survey for his master’s thesis, Fred came up with a new methodology for forecasting how waves transform in response to variations in the shape and size of coral reefs.
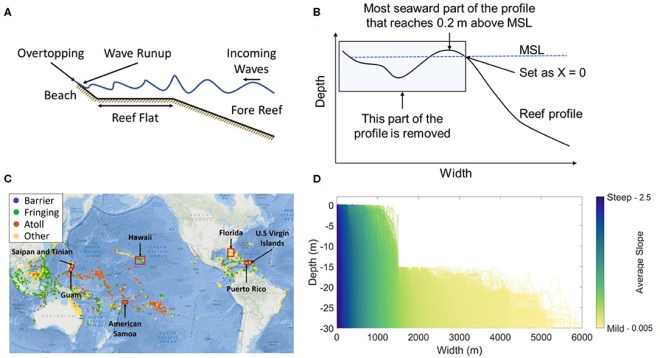
Fast forward three years to when Fred began his own thesis. We now had access to a mind-boggling dataset of over 30,000 measured coral reef cross-sections from locations around the world! However, instead of too little data, we now had too much! If we wanted to simulate a whole range of wave and sea level conditions on each of the reefs in our dataset, it might take months or even years to run our models! Fred had the daunting task of distilling that gargantuan database down to a more manageable number of reef cross-sections.
But how do we choose which cross-sections are the most useful or important to look at? Even though every coral reef is, like a beautiful snowflake, utterly unique, surely there must be some general trends or similarities that we can identify, right? This question lies at the heart of Fred’s research, and to answer it, he turned to many of the same powerful statistical and machine-learning techniques used by the likes of Google and Facebook to harvest your life’s secrets from the internet or power self-driving cars. Maybe we can use some of this technology for good, after all!
The main approach that Fred used in this study was cluster analysis, a family of techniques that look for similarities or differences between entries in a dataset, and then group the entries accordingly into clusters. The entries within one cluster should be more similar to each other than to the entries in other clusters. In our case, this meant grouping the reefs into clusters by similar shape and size. This allowed us to increase efficiency and reduce redundancy by proceeding with 500 representative cross sections, instead of the entire database of 30,000.

Other studies in our field have tried similar approaches (such as this Brazilian study of coral reef shape), but the innovative part of Fred’s technique was to also account for similarities in the hydrodynamic response of the waves to each reef via a second round of clustering. Wave transformation on coral reefs can be immensely complicated, so it is entirely possible that two reef profiles could look very different, but lead to the same amount of flooding in the end. Since we are mainly concerned about the flooding (rather than a classification for ecological or geological purposes about coral reef formation and evolution), this suits us just fine!
In the end, Fred was able to distill this colossal dataset into between 50-312 representative cross sections that can forecast wave runup with a mean error of only about 10%, compared to predictions made using the actual cross sections. This opens the door wide for a range of future applications, such as climate change impact assessments or coral reef restoration projects. Right now, we are working on a new project that will apply Fred’s approach to the development of a simplified global early-warning system for wave-induced flooding on coral reef-fronted coasts.
Great work, Fred, and congratulations on your first publication! I am excited to see where this road takes us!
Sources:
- Scott, F., Antolinez, J.A.A., McCall, R.C., Storlazzi, C.D., Reniers, A.J.H.M., & Pearson, S.G. (2020). Hydro-morphological characterization of coral reefs for wave-runup prediction. Frontiers in Marine Science. [Link]
- Scott, F. (2019). Data reduction techniques of coral reef morphology and hydrodynamics for use in wave runup prediction. [Link]. TU Delft MSc thesis in cooperation with Deltares and the US Geological Survey.
- Scott, F., Antolinez, J.A., McCall, R.T., Storlazzi, C.D., Reniers, A., and Pearson, S., 2020, Coral reef profiles for wave-runup prediction: U.S. Geological Survey data release [Link].
