

Check out our new paper here!
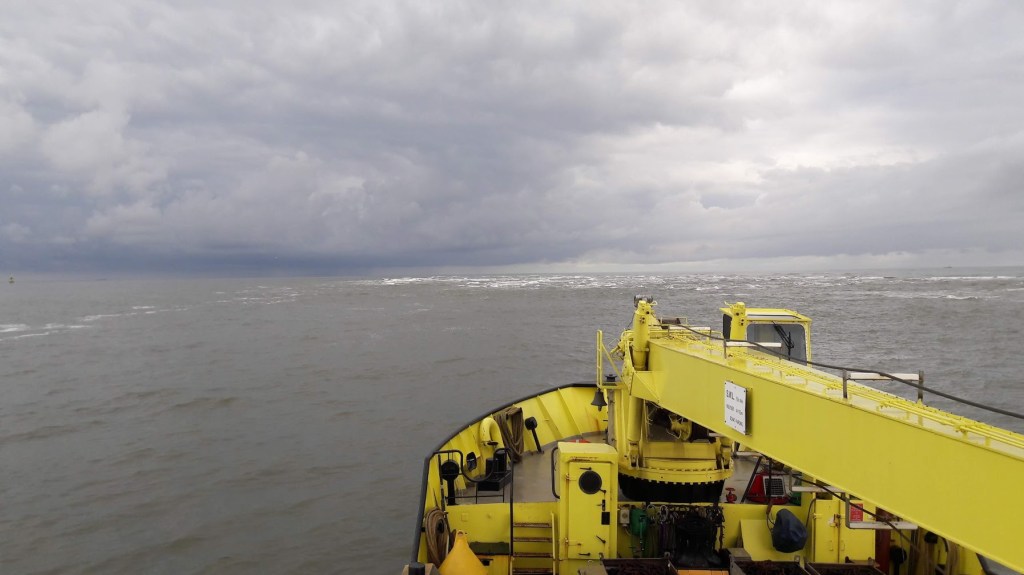
Three years ago, I experienced one of the highlights of my professional career so far. Alongside researchers from 3 universities, the Dutch government, and several other institutions, we carried out a 40-day field measurement campaign at Ameland Inlet in the north of the Netherlands. We deployed several frames loaded up like Christmas trees with every instrument imaginable: ADVs and ADCPs to measure waves and currents, LISSTs and OBSs to measure suspended sediment, a YSI multiprobe to measure salinity and other water quality indicators, and even a 3D sonar to track the migration of ripples along the seabed.

Four of our five frames survived the relentless ebb and flow of the tide, and even two major storms (one of which left me stranded in Germany after the wind blew down all the overhead train power lines between Berlin and Amsterdam!). In the end, we obtained enough data to keep me busy for probably 3 PhDs, if not the rest of my career. This is just as well, since that last frame was buried in the storm, and based on our understanding of the local dynamics, it will likely re-emerge in another few decades, just in time for my retirement! I look forward to sharing my other findings with you here in the next few months!
Although it used to be the norm for scientists to squirrel away their data, there is an increasing movement towards open accessibility of research data. This improves transparency and accountability in the scientific process, and opens up new opportunities for collaboration. The data we collected is now available in its entirety here on the 4TU web portal or on Rijkswaterstaat’s interactive web viewer.
However, there is a lot of data – I mean A LOT! To help researchers interpret the contents of this database, we prepared an overview paper, which was finally published in the journal of Earth System Science Data! It is also accompanied by a more detailed report, which gets into the nitty-gritty details we didn’t have room to describe in the paper. Nobody likes to read a phonebook-sized report, but it’s nice to have the information there for the few brave souls who do want to comb through our dataset.
It was all a huge team effort, as evidenced by the 20+ co-authors. My contribution to this paper focused on the processing of the LISST and YSI multiprobe data, which tell us about the size of particles floating through the water, and how salty that water is. I also designed the maps. As a kid, I loved to read and draw maps, and I think that 7-year-old Stuart would have been tickled to know that he would still be dabbling in cartography all these years later.
As the research in the rest of my PhD (and beyond!) will continue to focus on the fruits of this measurement campaign, I am very keen to work together and collaborate with other researchers who have an interest in this dataset. Please get in touch if you are interested!
