What is the fate of nourished sand? What are the pathways of sediment on an ebb-tidal delta or in a tidal basin? What role does sediment play in the UNESCO-world heritage area of the Wadden Sea? We are looking for a curious and motivated postdoc to work with us on an exciting project here at TU Delft in the Netherlands. The main goal of this position is to develop and test novel simulation approaches to trace pathways of different sediment types, and to predict sediment dispersal and morphodynamic responses to different nourishment strategies.
I also worked on this project as a postdoc until recently starting a new position, and I really enjoyed both the topic and teammates. Now you have the opportunity to join our team and continue developing this research! A summary of previous work on the project can be found here: https://coastallycurious.com/2022/12/15/tracking-sand-that-hides-from-the-sun/
Come join our TRAILS team! Feel free to get in touch with us if you have any questions. Applications close March 12th, 2023!
Keeping Dutch feet dry is mainly done by placing piles of sand along the coast as “nourishments”. These nourishments build out the beaches and dunes to act as a protective buffer against storms. However, as was recently pointed out by an official at Rijkswaterstaat, the Dutch water ministry, the Hamvraag or “bacon question” is still “where the heck does all that sand actually go?”
Knowing where nourished sand goes is important for understanding the ecological impact of nourishments, as well as their effectiveness. If you want your sand to reach a certain destination, how much of it actually gets there and how quickly?
How do sand and mud move around on our coasts? This is a question that we need to answer in order to sustainably manage coastlines in the face of sea level rise and climate change. To do so, we use a combination of field measurements and computer simulations at Ameland Inlet in the Netherlands. In the course of my PhD we developed several new methods, including morphodynamic mapping techniques, a sediment composition index (SCI) derived from optical and acoustic measurements, techniques for sediment tracing, the sediment connectivity framework, and a Lagrangian sediment transport model (SedTRAILS). Together, these approaches reveal new knowledge about our coasts which can be used for managing these complex natural systems.
That’s a bit of a mouthful, so let’s break it down and try to explain what I have been doing with sand for the last half-decade…
Ebb-tidal deltas are notoriously unpredictable. Battered about by waves and tides, their ever-shifting sands can be a royal pain in the arse for everyone from coastal residents to pirates. I have spent most of the past five years trying to identify the pathways that sand takes across these deltas as part of my PhD. However, the holy grail of ebb-tidal delta research is to take that one step further and make accurate morphodynamic predictions of their evolution on timescales of decades.
This past year, Denzel Harlequin took up the challenge, and I am pleased as punch to announce that last week he successfully defended his master’s thesis, ”Morphodynamic Modelling of the Ameland Ebb-Tidal Delta”. This is a really tricky problem to solve because of the complexity of the processes that need to be simulated.
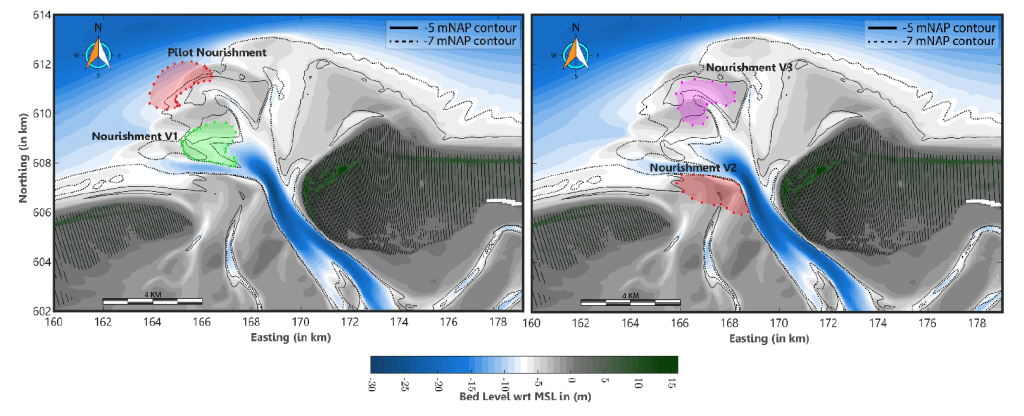
What’s cool about Denzel’s work is that brings us closer to good morphodynamic predictions than we were before. Furthermore, where the predictions deviate from reality, he illuminates the areas where we still need to make improvements — specifically, our representation of wave-driven transports. Denzel also shows how the location of a sand nourishment can have major knock-on effects on the evolution of the ebb-tidal delta.
Different nourishment designs tested by Denzel. If you place the sand in a more dynamic area like a channel, it can have a much wider effect on the rest of the ebb-tidal delta.
Denzel is a very talented modeller and I am delighted that he has joined us as a new colleague in the Applied Morphodynamics department at Deltares. I look forward to many more great collaborations to come!
Ebb-tidal deltas are gigantic piles of sand that form at the seaward mouth of tidal inlets. They are constantly on the move, shifting shape and size in response to the waves and tides. Where exactly is that sand going? This is a question I have been struggling with for the past 5 years during my PhD, and we have recently made great strides in part due to the efforts of Paula Lambregts.
Yesterday, Paula Lambregts successfully defended her master’s thesis, “Sediment bypassing at Ameland inlet“. I had the great honour of co-supervising Paula’s research throughout the last ten or so months, and I am enormously proud of her. Her project encompassed a range of approaches, including bathymetric analysis and numerical modelling, to solve the mystery of the sediment pathways.
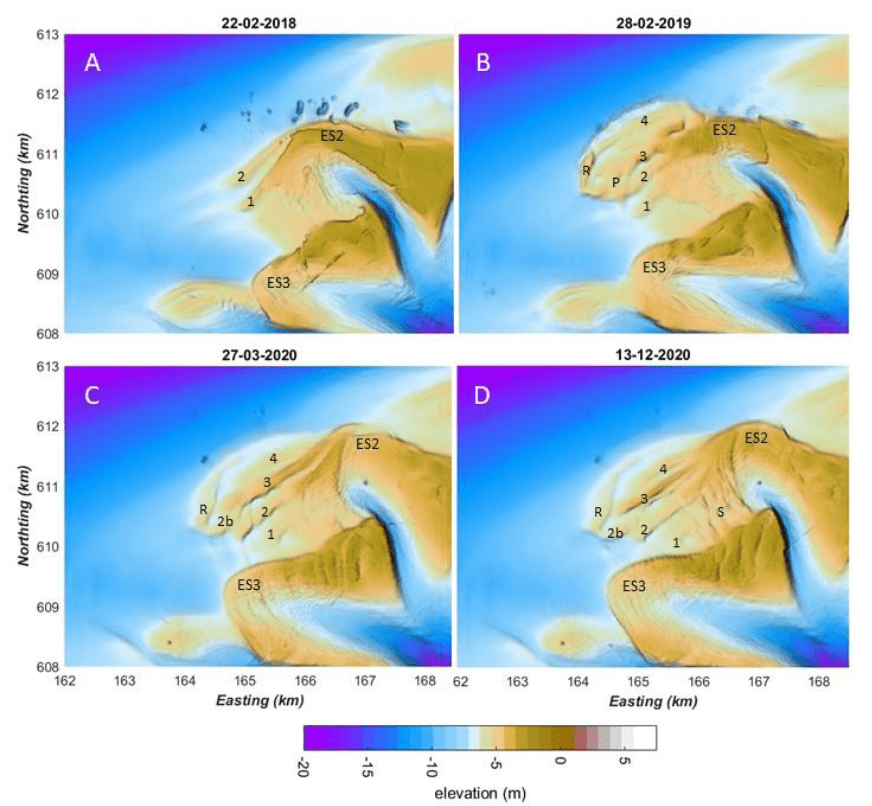
First, Paula’s detective work led her to examine detailed measurements of the seabed bathymetry at Ameland Inlet in the Netherlands, taken over the past fifteen years. These measurements give snapshots of the underwater delta landscape. By comparing the bathymetry from different months or years, we can track the delta’s evolution. In the image below, we see four snapshots of the ebb-tidal delta before and after the construction of a sand nourishment (i.e., the large pile of sand that appears in panel B). This nourishment was a large-scale pilot test to determine if creating sand deposits like this is a viable strategy for strengthening the coast of nearby islands.
Bathymetric maps showing Ameland Ebb-Tidal Delta before (A) and after (B,C,D) the construction of a massive sand nourishment. Paula’s analysis tracked how this nourishment evolved over time, smoothed and smeared out to the east and south east by the combined effects of waves and tides.
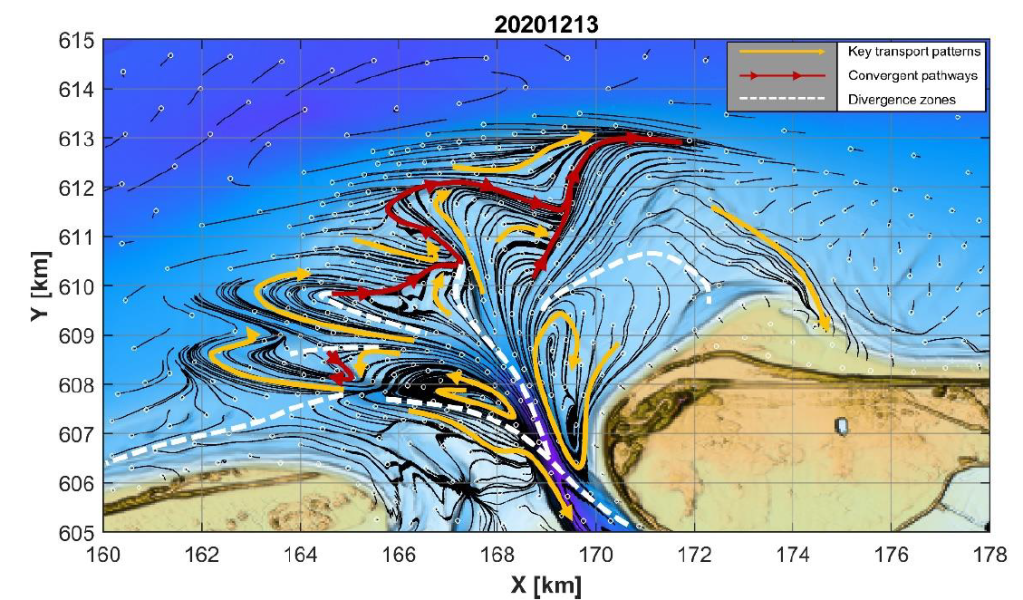
After describing how the delta has evolved in the past, Paula developed hypotheses about the physics underlying this behaviour- how do waves and tides move the sand around to create the patterns we observe? To answer this question, she used a combination of computer models to estimate sand transport pathways. This allows us to “connect the dots” and explain how the sand moved from one place to another. The first component was a D-Flow FM model, which is used to simulate the hydrodynamics (waves and tides) and sediment transport (where and how much sand moves). The second component of her modelling approach was to apply SedTRAILS, a brand-new tool developed by my colleagues and I at Deltares for visualizing predicting sediment transport pathways. Using SedTRAILS, she was able to create some really cool maps that indicate where the sand goes.
Sediment transport pathways on Ameland ebb-tidal delta in 2020, as visualized using SedTRAILS. The small white circles indicate the source locations of sediment, and thin black lines show the sediment pathways originating from those sources. The yellow lines highlight major transport pathways, and the red lines indicate convergent zones where multiple pathways meet. The white dashed lines indicate divergence zones, where the transport pathways veer away from and (on average) do not cross.
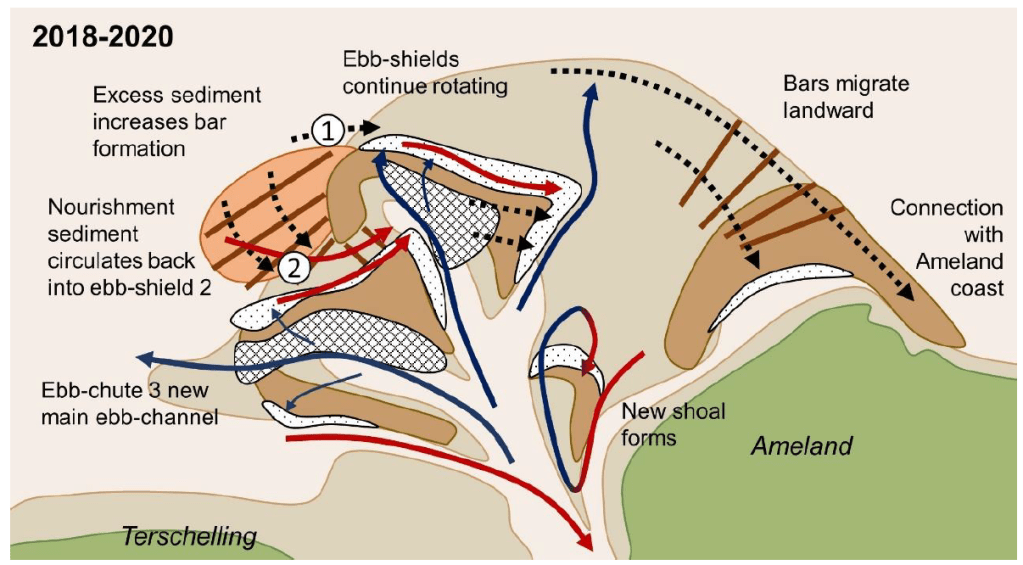
Drawing on her prior expertise in geology, Paula combined those two lines of evidence (the measurements of the seabed and the modelled sediment pathways), to come up with a series of fantastic conceptual diagrams. These diagrams distill the mysterious piles of sand and complex spaghetti of the images above into a more easily understandable picture:
Paula’s conceptual model summarizing all of the different processes shaping Ameland ebb-tidal delta in 2020. Check out her thesis to see the complete evolution over the past 15 years!
The work that she did is extremely valuable for coastal management, since it gives more insight into where (and where not!) to construct sand nourishments. It also brings new insights to science about how these complex systems work. Last of all, it is enormously helpful for the research that we are continuing to do at TU Delft and Deltares. In September I will continue on with the work on sediment transport pathways at tidal inlets begun during my PhD, and build on the work that Paula has carried out in her thesis project. I am extremely proud of her and hope that we can continue to collaborate in the future!
At TU Delft, a requirement for our PhD defense is to make ten propositions based on what we have learned during the previous years. Claims posed by my friends and colleagues deal with the nitty gritty details (“All diffusive processes can be derived from an advective one, and failing to do so yields incorrect modelling“[1]) but also the bigger picture of how we do what we do (“The way morphological models are presented and interpreted has a lot in common with predictions of snow depth in five years on December 26th at 4pm. The knowledge in these models deserves a better presentation“[2]).
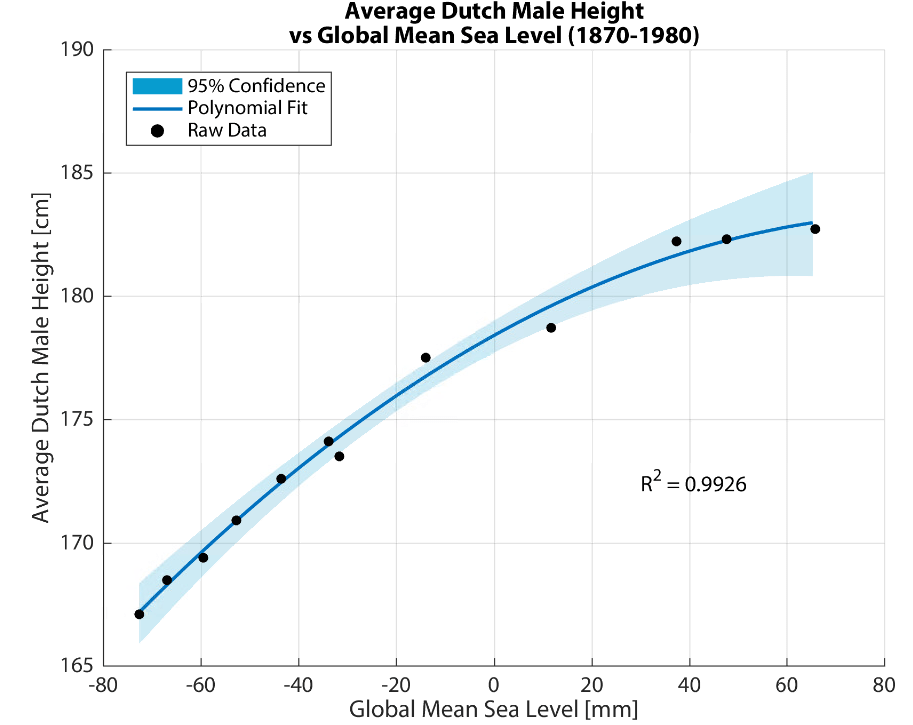
The propositions must be both defendable and opposable, so as to stimulate an interesting debate during the defense. Some of the propositions should reflect the findings of our research, but it is also traditional to include statements that have nothing to do with it. One colleague[3] even suggested (tongue in cheek) that the increase in the height of Dutch men over time could be explained by sea level rise. I couldn’t resist analyzing the data myself, and the results were surprisingly good:
Spurious correlation of the week! As John von Neumann said, “With four parameters I can fit an elephant, and with five I can make him wiggle his trunk.”
These propositions are a chance to inject a bit of last-minute philosophizing into our Doctorates of Philosophy, and range from the wise (“No wind is favourable if a person does not know to what port (s)he is steering – Seneca“[4]) to the downright cheeky (“This proposition is not opposable“[1]).
What I Learned by Counting Sand for 5 Years
As the clock is ticking on my own PhD (259 days, 13 hours, 39 minutes, and 51 seconds, but who’s counting? *eye twitches*), I started preparing some propositions of my own (obviously in a fit of procrastination on my dissertation). After nearly five years of scrutinizing sand and contemplating connectivity, my research has led me to an inescapable conclusion:
Ebb-tidal deltas are badass morphological features (BAMFs), (c.f. Phillips [2015]).
What, pray tell, is an ebb-tidal delta, and why is it so badass? Ebb-tidal deltas are large underwater piles of sand at the mouth of estuaries and tidal inlets, deposited by outflowing tides and reshaped by waves. I spend my days studying how waves and tides move sand around on the Ameland ebb-tidal delta in the northern part of the Netherlands (see below). We need to know this in order to plan ecologically-sustainable flood protection measures for the Dutch coast. A morphological feature is just a fancy name for some part of a landscape, like a hill or a valley or a beach.
An ebb-tidal delta is the giant pile of sand located at the mouth of a tidal inlet like this one. This may not sound glamorous, but understanding the way it moves around is extremely important for ensuring safe navigation and for predicting erosion and flooding of adjacent coasts.
What makes a badass “badass”?
Phillips[5] defines the archetypal badass as “individualistic, non-conformist, and able to produce disproportionate results”, and applies this concept to geomorphology (the study of how landscapes evolve, at the crossroads of geology and physical geography). Ebb-tidal deltas meet these three criteria, which makes them badass morphological features (BAMFs):
Ebb-tidal deltas are each unique (in shape, location, composition, and in terms of the environmental forces shaping them (like waves and tides)), and hence individualistic.
Ebb-tidal deltas are chaotic systems which defy accurate prediction using physics-based numerical models[6], and hence are non-conformist or “naughty”[7]. This numerical naughtiness is a serious problem for coastal engineers and scientists, since a failure to accurately predict ebb-tidal delta evolution can threaten public safety and lead to costly property or infrastructure damage. They do not “play by the rules” of our existing physics-based deterministic models.
Ebb-tidal deltas are highly nonlinear systems which can greatly amplify small instabilities[8], and hence produce disproportionate results.
In addition to the strict definitions of Phillips[5], ebb-tidal deltas are also “belligerent or intimidating, ruthless, and tough”, other traits reflective of badassery [Oxford Engish Dictionary]. The Columbia River ebb-tidal delta alone is responsible for dozens shipwrecks in the past century, and Ameland ebb-tidal delta has also featured numerous wrecks throughout its history.
Quoting Thomas Pynchon[9], Phillips also notes that badasses are “able to work mischief on a large scale”. Ameland ebb-tidal delta covers an area of approximately 100 square kilometers, roughly the size of The Hague. Many ebb-tidal deltas around the world are even larger!
Seriously?
Now admittedly, ebb-tidal deltas are just big piles of sand. A big pile of sand is probably not the first thing that comes to mind when you hear the word “badass”, unless you are Ralph Bagnold or a Sarlacc. This could probably also be considered gratuitous personification or anthropomorphization.
I’m sure that many of my friends and family have been scratching their heads as to why I would sacrifice the latter half of my 20s to understand them better. A critical reader might ask, “is it possible that you have only convinced yourself that ebb-tidal deltas are cool out of self-preservation?” And the answer is yes. Yes, I have. Nonetheless, I remain steadfast in my assertion that ebb-tidal deltas exhibit major symptoms of geomorphological badassery.
Although the concept of geomorphological badassery may seem silly at first, it illuminates several important truths of our (mis)understanding of these complex bathymetric features. Ebb-tidal deltas are important to study for reasons of coastal flood protection, navigational safety, and ecological value, but we are bad at predicting how they will evolve. This is because each ebb-tidal delta is unique, making it challenging to generalize their behavior. Furthermore, their chaotic, non-conformist behavior renders many of our usual deterministic prediction techniques ineffective. Lastly, the amplifying effect of highly nonlinear physical processes means that small physical changes (e.g., the development of a tiny shoal) could have disproportionately large consequences (e.g., relocation of a channel several kilometers wide). As such, badassery provides a useful conceptual framework for describing the challenges presented by ebb-tidal deltas to coastal engineers and scientists.
It has been a crazy year, but work-wise I am on the final stretch, at least. Tonight at the ungodly hour of 12am CET, I will present my poster at the American Geophysical Union conference. It is at a much more reasonable 3pm PST in California where the conference organizers are located. If you have registered for the conference, you can see the poster via this link. Otherwise, I will try to put you in the loop here.
Estuaries are complex environments shaped by the interaction of waves, tides, rivers, and humans. Understanding how sand and mud move through estuaries is essential for their effective management. In an approach known as connectivity, the pathways taken by sand and mud through estuaries can be represented as a connected network of nodes and links, similarly to a subway map. Connectivity provides numerous mathematical techniques and metrics that are well-suited to describing and comparing these pathways in estuaries.
Network diagrams depict the sediment transport pathways of each estuary as a series of nodes and connecting links. The Mouth of the Columbia River (1) and San Francisco Bay (2) are on the west coast of the United States, while Ameland Inlet (3) and the Western Scheldt (4) are in the Netherlands. Red arrows indicate the 90th percentile of all connections in terms of sediment fluxes, superimposed on greyscale bathymetry of each estuary.
We use connectivity to map out and analyze sand and mud pathways in four estuaries around the world: the Wadden Sea (the Netherlands), Western Scheldt (NL), San Francisco Bay (US), and Columbia River (US). Our analysis is based on the outcome of numerical simulations, and we explore the benefits of different simulation techniques. We conclude that connectivity is a useful approach for visualizing and comparing the pathways that sand and mud takes through different estuaries. We can use this method to plan and predict the impact of human interventions in these environments, such as dredging.
However, a comparison of connectivity metrics suggests a dependency not just on sediment transport processes, but also on the choices made in schematizing networks from underlying models. Essentially, we’re not comparing apples to apples yet, so if we are going to make comparisons between different estuaries, we need to make sure that we set up our models in an equivalent way. Our ongoing research will focus on optimizing these numerical models to make more meaningful quantitative comparisons of different estuaries.
What’s it about? As sand moves along coasts and through estuaries, the pathways it takes are determined by a complex combination of waves, tides, geology, and other environmental or human factors. These pathways are hard to analyze and predict using existing approaches, so we turn to the concept of connectivity.
What is connectivity? Connectivity represents the pathways that sediment takes as a series of nodes and links, much like in a subway or metro map (see here for a primer). This approach is well used in other scientific fields like neurology, oceanography, and fluvial geomorphology, but in our study we apply these techniques to coastal sediment dynamics.
So what? To show how the sediment connectivity approach can be used in practice, we map sediment pathways with it at Ameland Inlet, an estuary in the Netherlands. The statistics we compute using connectivity let us quantify and visualize these sediment pathways, which tells us new things about the coastal system. We can also use this approach to answer practical engineering questions, such as where to place sand nourishments for coastal protection. We hope to use sediment connectivity to predict the response of our coasts to climate change, and the human adaptations that these changes provoke.
A conceptual summary of our paper on sediment connectivity at Ameland Inlet in the Netherlands.(a,c) We can schematize the sediment transport pathways in an estuary as a series of nodes (A,B,C,…) and the links connecting them. (b) This network can in turn be represented by a matrix, showing where the sediment is coming from (a source) and where it’s going to (a receptor). In this form, we can investigate questions like, “where does the sand in node F go?” (d), or “where does the sediment reaching node D come from?”(f). In my research, we are most interested in answering questions like, “what is the main pathway between the two islands, node A and G?” (e). We can also learn how the system is organized into “communities” that share sand (g), and how that changes when pathways are added or removed (h).
It has been a long journey, beginning with The Magical Figure that Changed My Entire PhD and now culminating in this publication. I am especially indebted to my supervisors, Bram van Prooijen and Zheng Bing Wang, for their constant support. I am also grateful to my other co-authors, Edwin Elias from Deltares and Sean Vitousek at USGS, for seeing potential in this approach and really strengthening and clarifying my story. I was also blessed with curious and constructive reviewers who provided a much-needed non-engineering perspective on our work.
Now that this paper is out, the fun can really begin! I have lots of fun ideas for applying connectivity to other estuaries around the world including the Mouth of the Columbia River and San Francisco Bay. We are also in the process of developing new modelling tools that well help us better unravel how estuaries and coasts are connected. Stay tuned!
Sources:
Pearson, S.G., van Prooijen, B.C., Elias, E.P.L, Vitousek, S., & Wang, Z.B. (2020). Sediment Connectivity: A Framework for Analyzing Coastal Sediment Transport Pathways. Journal of Geophysical Research: Earth Surface. [Link]
Three years ago, I experienced one of the highlights of my professional career so far. Alongside researchers from 3 universities, the Dutch government, and several other institutions, we carried out a 40-day field measurement campaign at Ameland Inlet in the north of the Netherlands. We deployed several frames loaded up like Christmas trees with every instrument imaginable: ADVs and ADCPs to measure waves and currents, LISSTs and OBSs to measure suspended sediment, a YSI multiprobe to measure salinity and other water quality indicators, and even a 3D sonar to track the migration of ripples along the seabed.
One of the five measurement frames that we deployed in Ameland back in Fall 2017. It was stacked full of instruments to measure the waves, currents, suspended sand and mud, salinity, ripples, and more.
Four of our five frames survived the relentless ebb and flow of the tide, and even two major storms (one of which left me stranded in Germany after the wind blew down all the overhead train power lines between Berlin and Amsterdam!). In the end, we obtained enough data to keep me busy for probably 3 PhDs, if not the rest of my career. This is just as well, since that last frame was buried in the storm, and based on our understanding of the local dynamics, it will likely re-emerge in another few decades, just in time for my retirement! I look forward to sharing my other findings with you here in the next few months!
Although it used to be the norm for scientists to squirrel away their data, there is an increasing movement towards open accessibility of research data. This improves transparency and accountability in the scientific process, and opens up new opportunities for collaboration. The data we collected is now available in its entirety here on the 4TU web portal or on Rijkswaterstaat’s interactive web viewer.
However, there is a lot of data – I mean A LOT! To help researchers interpret the contents of this database, we prepared an overview paper, which was finally published in the journal of Earth System Science Data! It is also accompanied by a more detailed report, which gets into the nitty-gritty details we didn’t have room to describe in the paper. Nobody likes to read a phonebook-sized report, but it’s nice to have the information there for the few brave souls who do want to comb through our dataset.
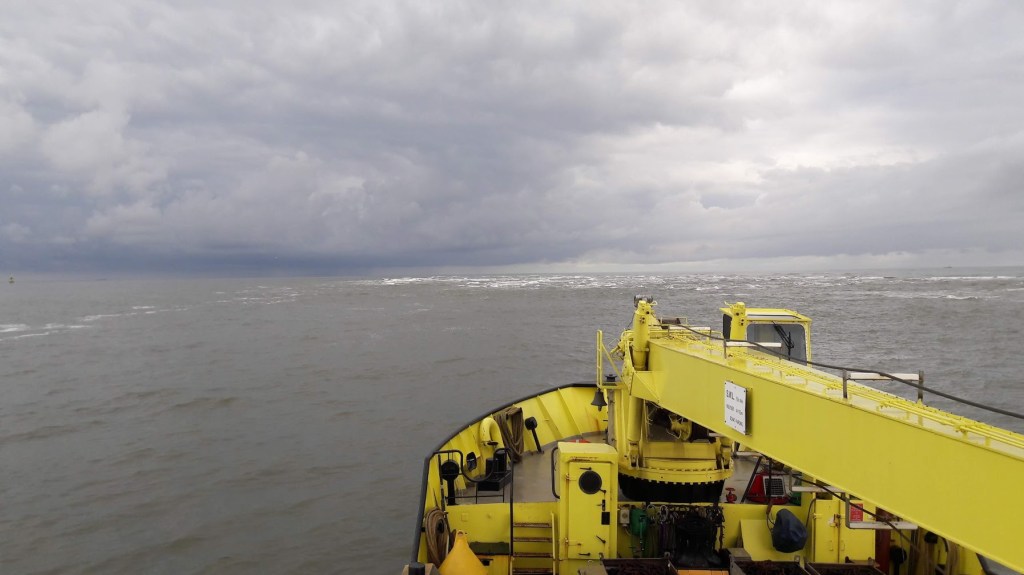
Sailing across the Vlie ebb-tidal delta on our way to retrieve the measurement frames at the end of the field campaign.
It was all a huge team effort, as evidenced by the 20+ co-authors. My contribution to this paper focused on the processing of the LISST and YSI multiprobe data, which tell us about the size of particles floating through the water, and how salty that water is. I also designed the maps. As a kid, I loved to read and draw maps, and I think that 7-year-old Stuart would have been tickled to know that he would still be dabbling in cartography all these years later.
As the research in the rest of my PhD (and beyond!) will continue to focus on the fruits of this measurement campaign, I am very keen to work together and collaborate with other researchers who have an interest in this dataset. Please get in touch if you are interested!
The main protective barrier for the Netherlands against the threat of flooding from the sea is a row of colossal sand dunes and wide beaches that stretch the length of their coast. However, that barrier is not completely natural — since the Dutch coast is in a constant state of erosion, the sand in their coastal zone has to be continually replenished. This replenishment takes the form of nourishments, which are essentially just massive piles of sand placed on beaches, dunes, or just offshore. The Dutch are lucky, since the bottom of the North Sea is covered in sand for hundreds of kilometers in every direction, meaning that there is a ready supply available for this purpose.
Although we still have plenty to learn about how to construct these nourishments effectively and in an environmentally friendly way, we are starting to get the hang of it — at least for long, straight, sandy coastlines like in Holland. However, this all gets a bit trickier when we turn our attention to the Wadden Islands dotting the northern coast of the Netherlands. These little islands sit between the stormy North Sea and the shallow Wadden Sea, a large estuary whose ecological value is unmatched in the Netherlands.
The coast of these islands is punctuated by a series of inlets connecting the two seas. Chaos reigns at these inlets, where strong tidal currents pass in and out, clashing with waves and whisking sandy shoals in and out of existence in unpredictable ways. This makes the inlets treacherous for ships, but also a challenge to simulate with our computer models and design nourishments for.
How, then, are are we meant to nourish the coast of these islands? We want to keep their inhabitants (and those on the nearby mainland) safe from flooding, but also need to be careful about inadvertently disrupting the vital ecological habitat of the Wadden Sea.
To answer that question, the Dutch government initiated the Kustgenese or Coastal Genesis project. In collaboration with several Dutch universities, companies, and research institutes, they set out to better understand how these tidal inlets work, and whether it is possible to effectively nourish them. The project focuses on Ameland Inlet, which is located between the islands of Ameland and Terschelling.
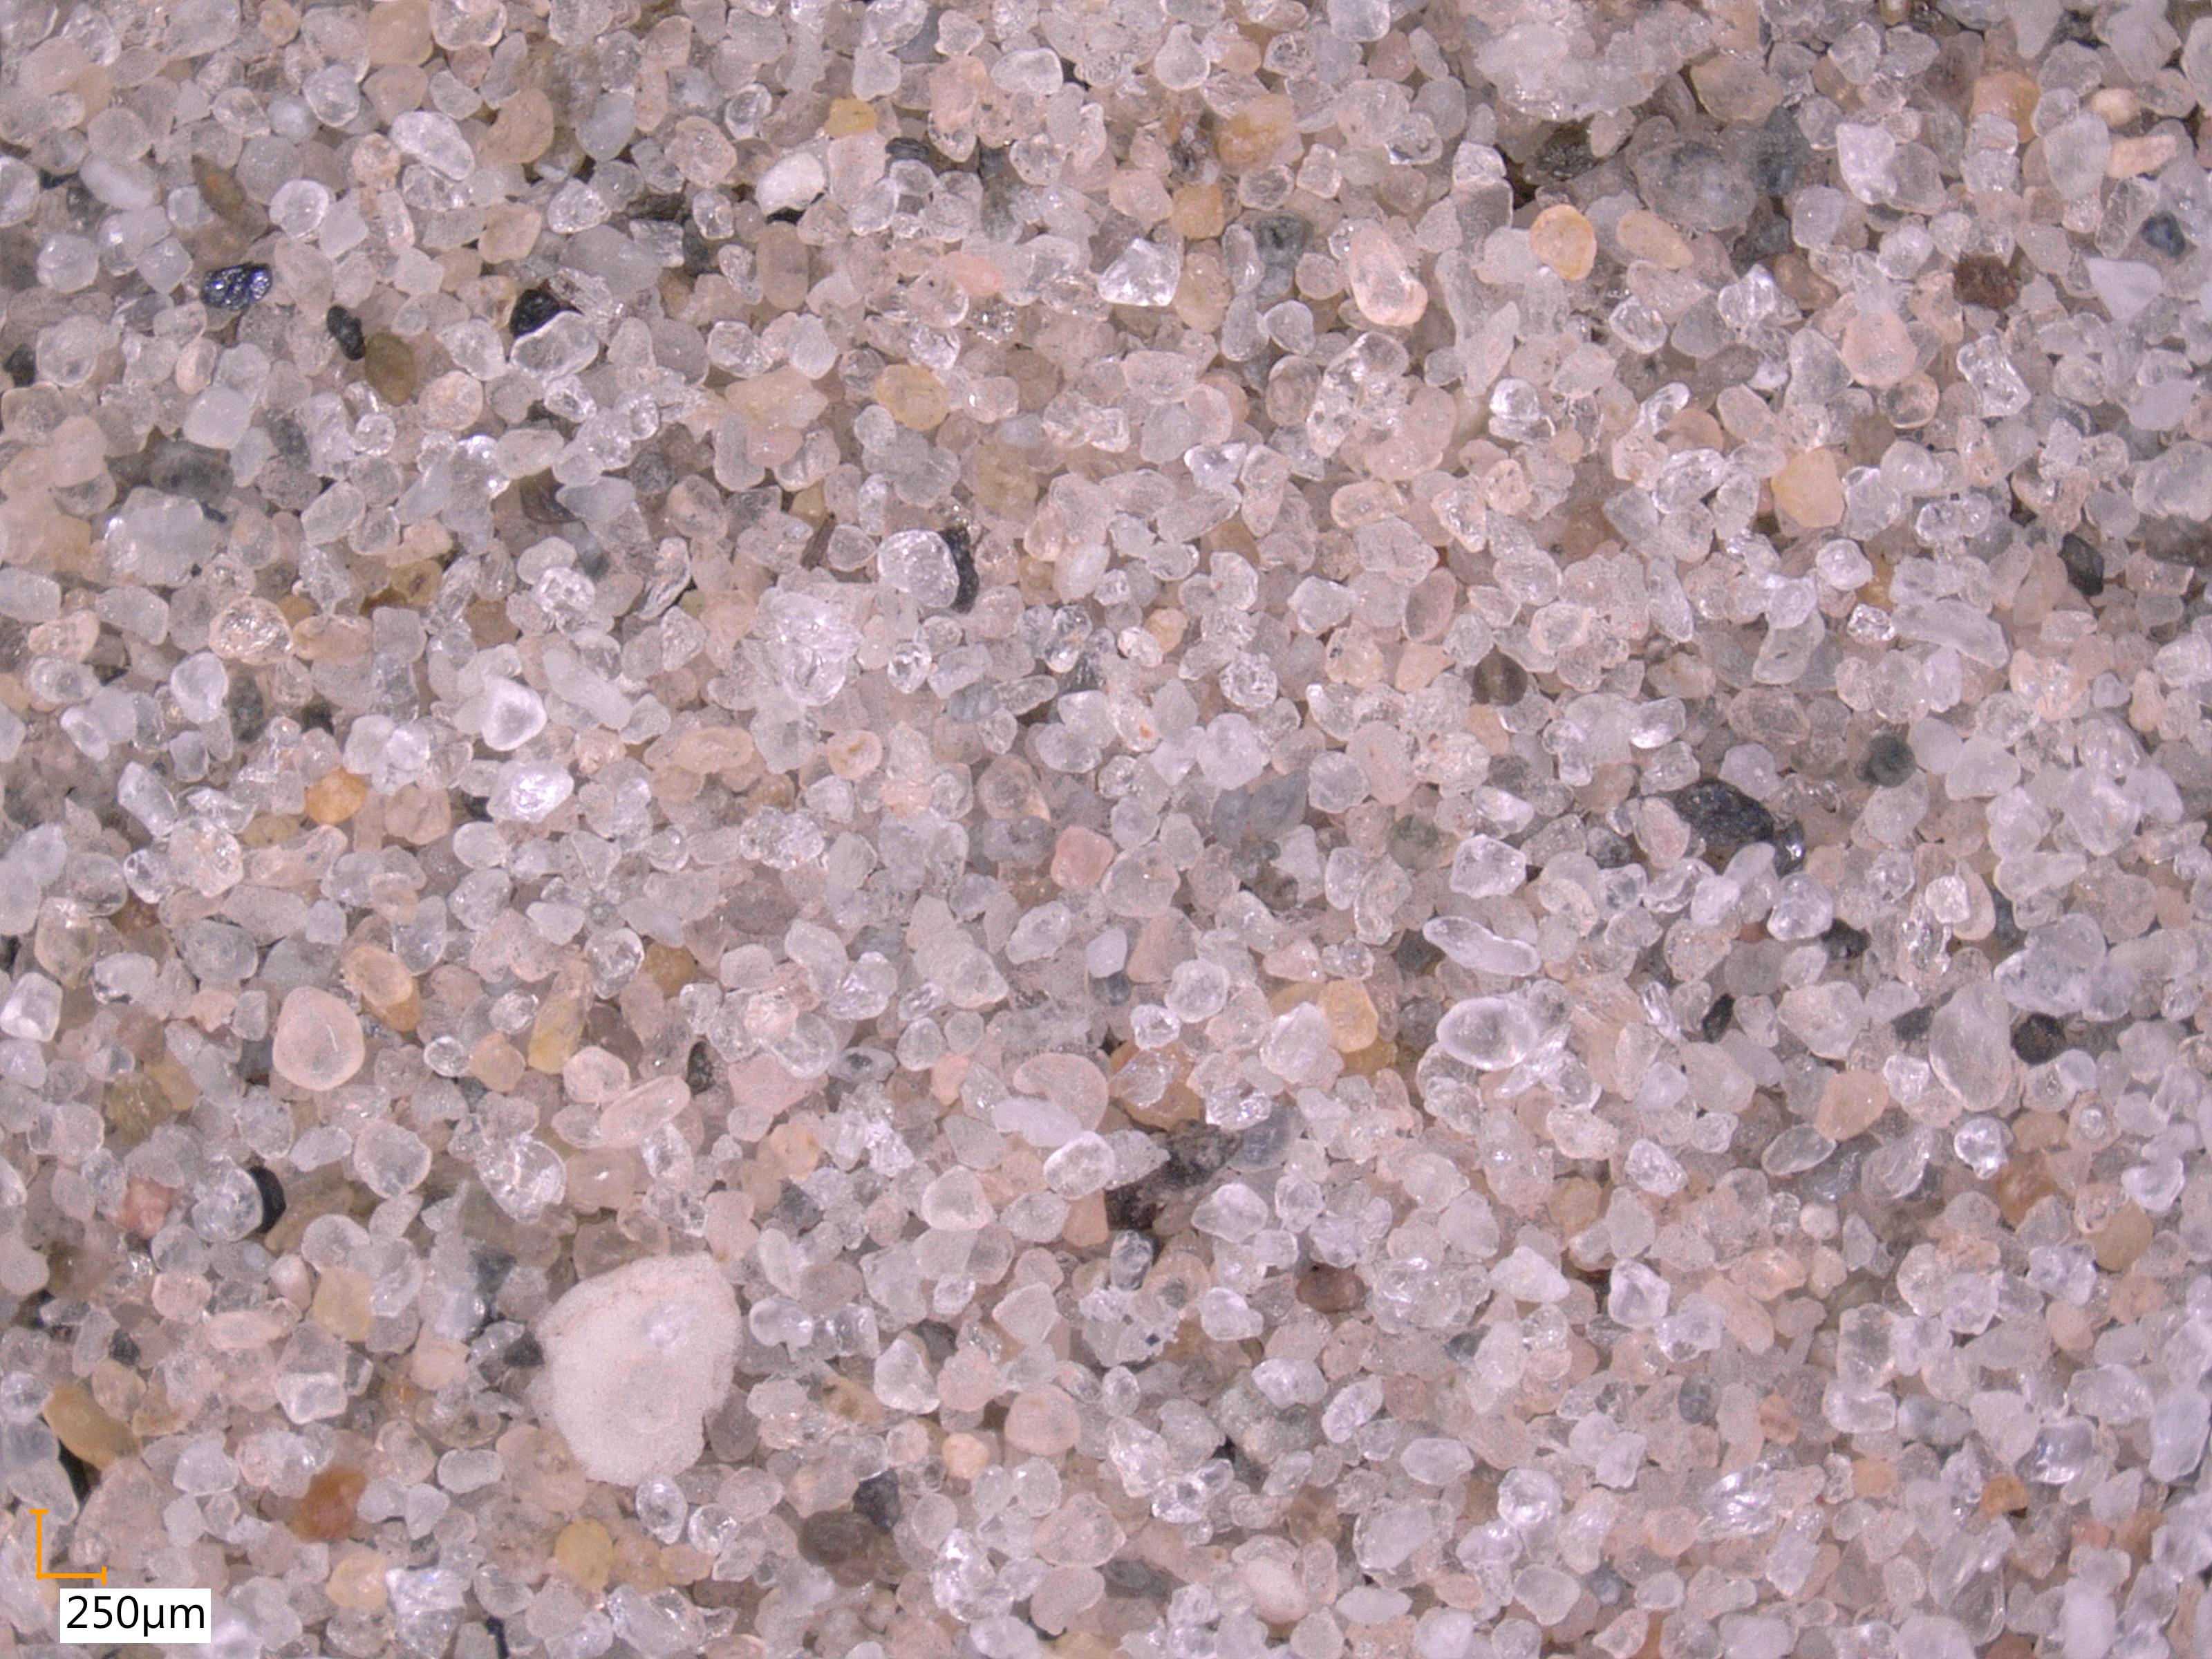
My PhD project is but a very tiny piece of the very large Kustgenese pie. My goal is to figure out specifically how the size of sand grains affects the paths that they take around tidal inlets. It has been the dream job for someone who has loved playing in the sand ever since he was a little kid. As a result, it has entailed a lot of time at my computer and in the laboratory, investigating the characteristics of the sand in Ameland inlet (that’s also why I have so many pictures of sand on this blog- we have a really cool microscope!). It is very fine sand and would be absolutely perfect for squidging your toes through on a hot day — if it weren’t at the bottom of the sea, that is:
Native sediment from Ameland ebb-tidal delta
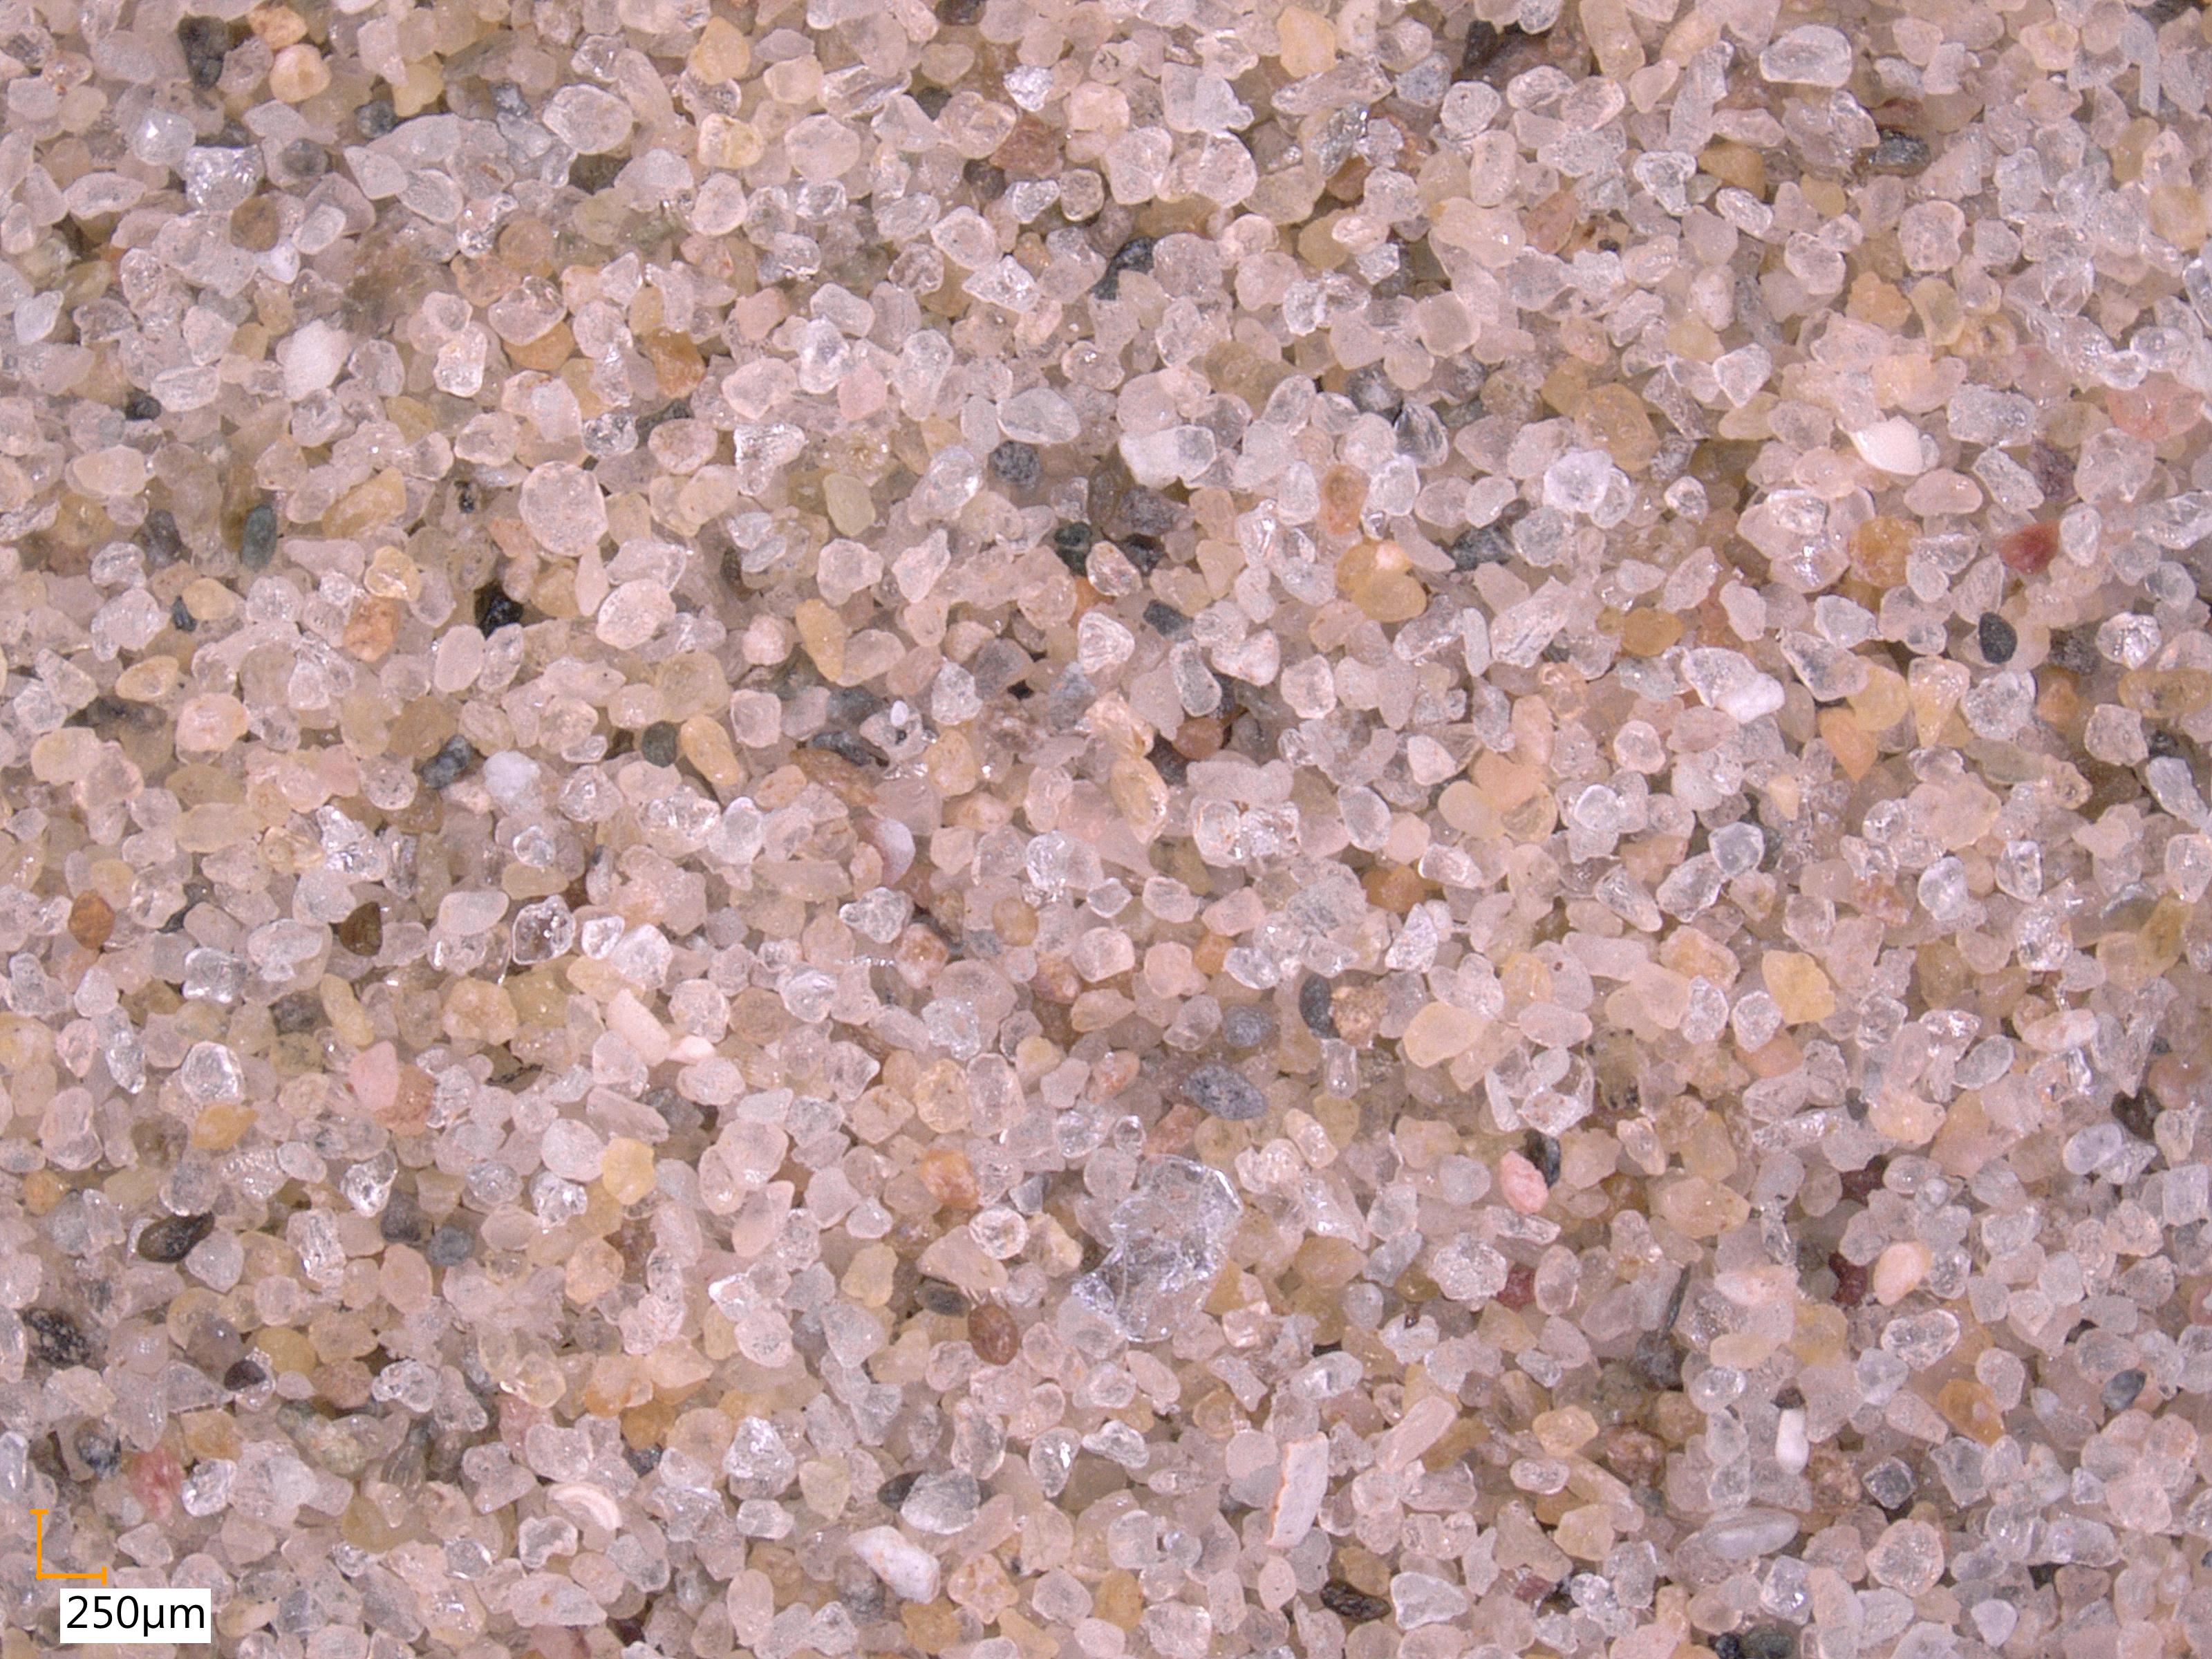
In the spirit of ‘why not?’, the Dutch government decided that the best way to test whether nourishments would be effective in this environment was to just go ahead and try one out last year. They dredged up 5 million cubic metres of sand (that’s enough to fill 3 Skydomes, for anyone reading this back home in Toronto) and placed them just outside the inlet. A few months ago, one of the Dutch government officials showed up at a meeting with a “present” for me… some sand from the nourishment!
Nourishment sediment dredged from offshore and placed on Ameland ebb-tidal delta.
Needless to say, I was very excited. At first glance, it appears quite similar to the native sediment, so that means it should behave in a similar manner. Time will tell how the nourishment evolves- we are watching very closely!