How do sand and mud move around on our coasts? This is a question that we need to answer in order to sustainably manage coastlines in the face of sea level rise and climate change. To do so, we use a combination of field measurements and computer simulations at Ameland Inlet in the Netherlands. In the course of my PhD we developed several new methods, including morphodynamic mapping techniques, a sediment composition index (SCI) derived from optical and acoustic measurements, techniques for sediment tracing, the sediment connectivity framework, and a Lagrangian sediment transport model (SedTRAILS). Together, these approaches reveal new knowledge about our coasts which can be used for managing these complex natural systems.
That’s a bit of a mouthful, so let’s break it down and try to explain what I have been doing with sand for the last half-decade…
Ebb-tidal deltas are notoriously unpredictable. Battered about by waves and tides, their ever-shifting sands can be a royal pain in the arse for everyone from coastal residents to pirates. I have spent most of the past five years trying to identify the pathways that sand takes across these deltas as part of my PhD. However, the holy grail of ebb-tidal delta research is to take that one step further and make accurate morphodynamic predictions of their evolution on timescales of decades.
This past year, Denzel Harlequin took up the challenge, and I am pleased as punch to announce that last week he successfully defended his master’s thesis, ”Morphodynamic Modelling of the Ameland Ebb-Tidal Delta”. This is a really tricky problem to solve because of the complexity of the processes that need to be simulated.
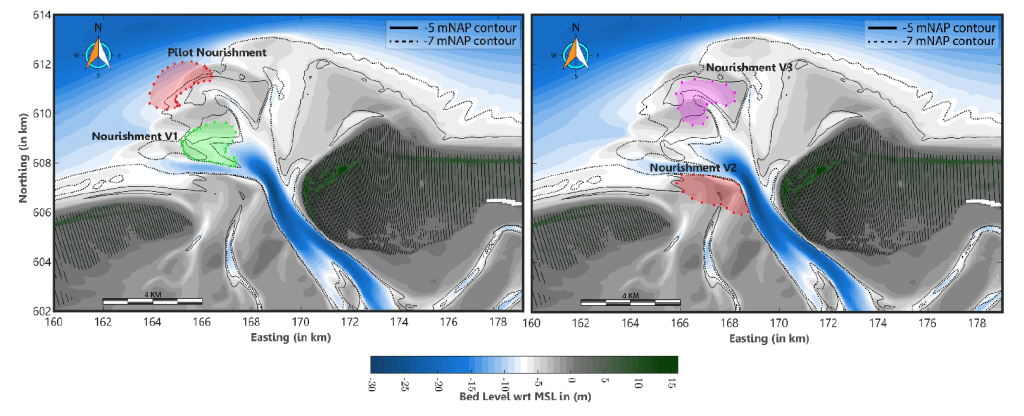
What’s cool about Denzel’s work is that brings us closer to good morphodynamic predictions than we were before. Furthermore, where the predictions deviate from reality, he illuminates the areas where we still need to make improvements — specifically, our representation of wave-driven transports. Denzel also shows how the location of a sand nourishment can have major knock-on effects on the evolution of the ebb-tidal delta.
Different nourishment designs tested by Denzel. If you place the sand in a more dynamic area like a channel, it can have a much wider effect on the rest of the ebb-tidal delta.
Denzel is a very talented modeller and I am delighted that he has joined us as a new colleague in the Applied Morphodynamics department at Deltares. I look forward to many more great collaborations to come!
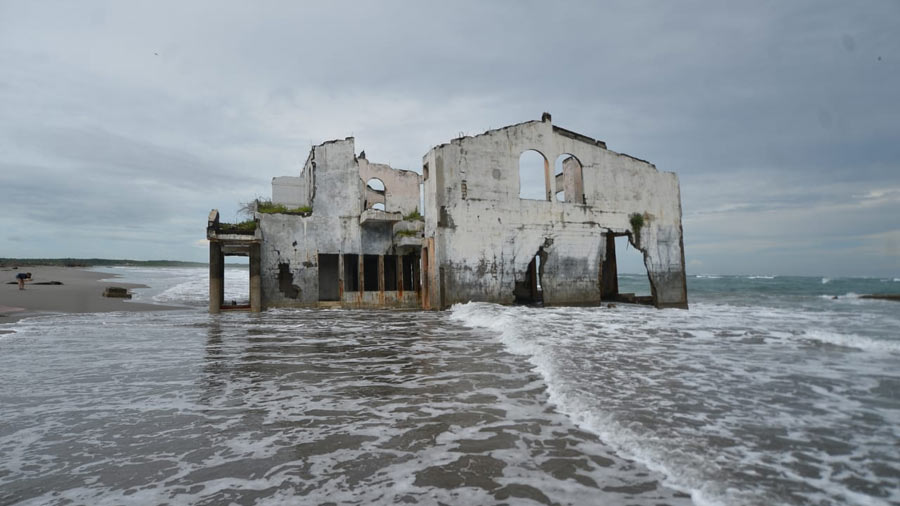
This morning as I was finishing my first coffee, one of my Deltares colleagues shared a video of a house on the beach in El Salvador. It was a surreal, post-apocalyptic, Planet of the Apes scene, made all the more mysterious by the accompanying news text (translated from Dutch): “Abandoned villa washes up entirely on the beach in El Salvador. The ruins of a villa have recently washed up on the beach of La Puntilla in El Salvador. It is a great mystery how the entire house ended up on the beach. Hurricane Elsa may have blown the building away.“
Having spent a fair bit of time professionally contemplating the destructive power of storm-generated waves on tropical coastlines, I was immediately skeptical about this hypothesis. How could a massive concrete structure like that survive such a pummeling and then just “wash up” on a beach?
Being a bunch of sediment transport nerds, my colleagues made all kinds of jokes about building a house-transport module into XBeach or SedTRAILS, or estimating the critical shear threshold and porosity of this giant “particle”. However my curiosity was irrevocably piqued- how did the damn thing get there? It must have been there the whole time, with the coast eroding around that, but how or why?
The Dutch news site was not particularly helpful, so I snooped around on the internet until I found a promising lead in the El Salvadorian news. Apparently the house is located near the village of La Puntilla, on the Pacific coast of El Salvador. Apparently it was a former hotel built (unwisely) right next to the beach. Suffering significant damage during Hurricane Mitch in 1998, it later became a church. Numerous people died in the former hotel and more recently among the ruins, so the building is even spookier than it first seemed. Indeed, after looking in Google Earth, it became apparent that the hotel has been there the entire time:
Before-and-after satellite photos of the abandoned hotel in La Puntilla, showing about 150 m of beach erosion between 2003 and 2021. The dashed line indicates the approximate position of the 2003 shoreline, based on some quick-and-dirty georeferencing and not accounting for potential variations in shoreline position due to the stage of the tidal cycle at the time each photo was taken. The tidal range on 50 km up the coast is about 2 m, so if the beach is very flat, the 2003 shoreline may actually be much closer at high tide.
So the hotel didn’t just “wash up on the beach” one day. But why exactly did it erode so much? Was there a particularly devastating storm? Is climate change or some nefarious human meddling in the coastline to blame? By zooming out a little bit, we can put this coastal erosion into a larger context.
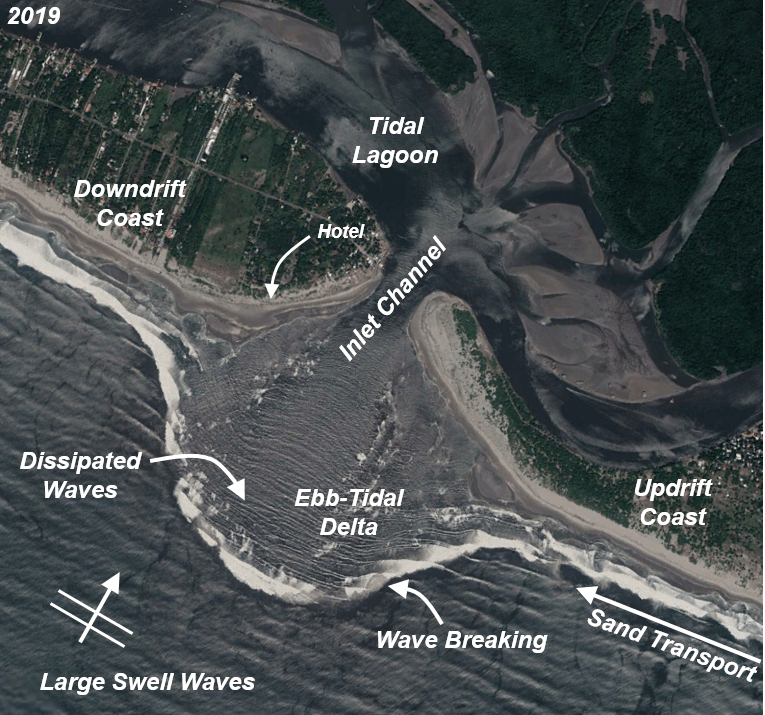
Google Earth is nearly always my first go-to tool for investigating a new site as a coastal engineer — you can learn so much by carefully observing how a given beach or estuary has changed through time, and by looking for evidence of the physical processes shaping the landscape. For instance, white foam usually indicates breaking waves, and by watching how sand piles up in certain places, we can estimate in which direction the sand is mostly moving. What can we learn about this site?
Tidal inlet at La Puntilla, El Salvador. The inlet channel connects the Pacific Ocean to a tidal lagoon, and is fronted by an underwater ebb-tidal delta. Large swell waves travel thousands of kilometers from the stormy south Pacific and break on the ebb-tidal delta (see the white foam), which greatly reduces their size. In this way, the ebb-tidal delta acts like a massive, sandy breakwater. Waves generate currents that push the sand from right to left along the coast, but the sand needs to cross the inlet. It makes this journey in regular spurts that lead to periodic accumulation and erosion of sand along the nearby coasts. This is the fate that befell our poor abandoned hotel.
It seems that the hotel was built on a type of coastal feature that is notorious for massive erosion world-wide: the beach adjacent to a tidal inlet. Tidal inlets connect lagoons with the ocean, the water rushing in and out of them several times a day. The water moves very fast and is stirred up by waves, so it can carry lots of sand and mud to and from the nearby coast. This means that this tidal inlets and the coastlines next to them have the potential to change shape dramatically over time. The inlet channel and smaller channels connected to it have a tendency to migrate back and forth across the underwater ebb-tidal delta like an out-of-control fire hose. If one of these channels is pushed up against the coast, it can cause massive erosion. This seems to be what happened to the abandoned hotel.
If you examine a timelapse in Google Earth (here), the incredibly dynamic nature of this system is apparent:
By a remarkable coincidence, this is the same process that I am investigating in my PhD: how does sediment move around at tidal inlets like this? It is not only the El Salvadorians who need to worry about this process — the topic is also a vital matter of investigation for Dutch coastal management authorities trying to protect their coast. Lesson learned: don’t mess with ebb-tidal deltas!
At TU Delft, a requirement for our PhD defense is to make ten propositions based on what we have learned during the previous years. Claims posed by my friends and colleagues deal with the nitty gritty details (“All diffusive processes can be derived from an advective one, and failing to do so yields incorrect modelling“[1]) but also the bigger picture of how we do what we do (“The way morphological models are presented and interpreted has a lot in common with predictions of snow depth in five years on December 26th at 4pm. The knowledge in these models deserves a better presentation“[2]).
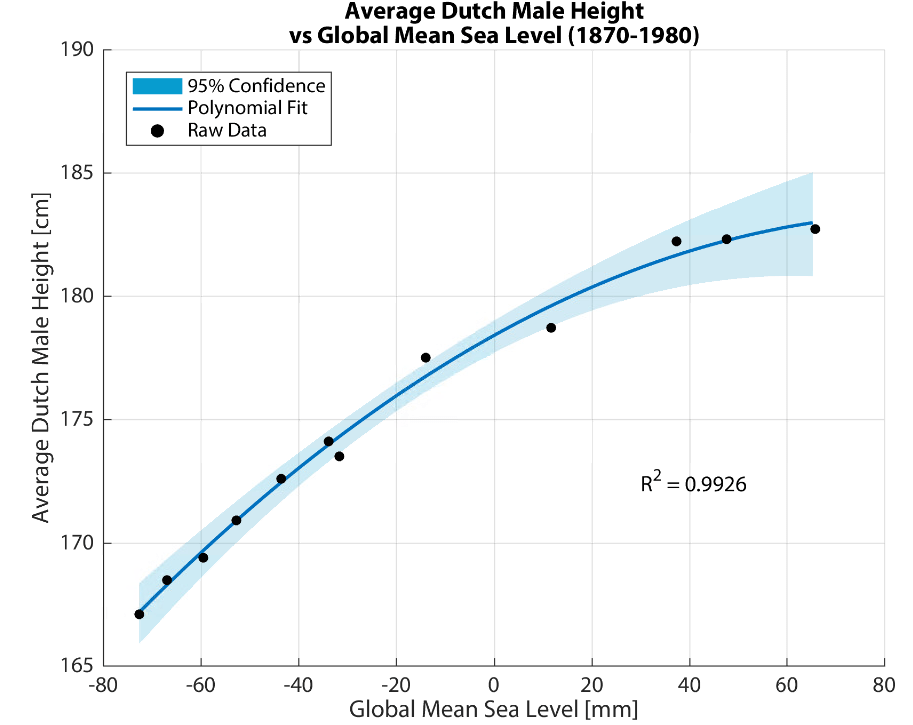
The propositions must be both defendable and opposable, so as to stimulate an interesting debate during the defense. Some of the propositions should reflect the findings of our research, but it is also traditional to include statements that have nothing to do with it. One colleague[3] even suggested (tongue in cheek) that the increase in the height of Dutch men over time could be explained by sea level rise. I couldn’t resist analyzing the data myself, and the results were surprisingly good:
Spurious correlation of the week! As John von Neumann said, “With four parameters I can fit an elephant, and with five I can make him wiggle his trunk.”
These propositions are a chance to inject a bit of last-minute philosophizing into our Doctorates of Philosophy, and range from the wise (“No wind is favourable if a person does not know to what port (s)he is steering – Seneca“[4]) to the downright cheeky (“This proposition is not opposable“[1]).
What I Learned by Counting Sand for 5 Years
As the clock is ticking on my own PhD (259 days, 13 hours, 39 minutes, and 51 seconds, but who’s counting? *eye twitches*), I started preparing some propositions of my own (obviously in a fit of procrastination on my dissertation). After nearly five years of scrutinizing sand and contemplating connectivity, my research has led me to an inescapable conclusion:
Ebb-tidal deltas are badass morphological features (BAMFs), (c.f. Phillips [2015]).
What, pray tell, is an ebb-tidal delta, and why is it so badass? Ebb-tidal deltas are large underwater piles of sand at the mouth of estuaries and tidal inlets, deposited by outflowing tides and reshaped by waves. I spend my days studying how waves and tides move sand around on the Ameland ebb-tidal delta in the northern part of the Netherlands (see below). We need to know this in order to plan ecologically-sustainable flood protection measures for the Dutch coast. A morphological feature is just a fancy name for some part of a landscape, like a hill or a valley or a beach.
An ebb-tidal delta is the giant pile of sand located at the mouth of a tidal inlet like this one. This may not sound glamorous, but understanding the way it moves around is extremely important for ensuring safe navigation and for predicting erosion and flooding of adjacent coasts.
What makes a badass “badass”?
Phillips[5] defines the archetypal badass as “individualistic, non-conformist, and able to produce disproportionate results”, and applies this concept to geomorphology (the study of how landscapes evolve, at the crossroads of geology and physical geography). Ebb-tidal deltas meet these three criteria, which makes them badass morphological features (BAMFs):
Ebb-tidal deltas are each unique (in shape, location, composition, and in terms of the environmental forces shaping them (like waves and tides)), and hence individualistic.
Ebb-tidal deltas are chaotic systems which defy accurate prediction using physics-based numerical models[6], and hence are non-conformist or “naughty”[7]. This numerical naughtiness is a serious problem for coastal engineers and scientists, since a failure to accurately predict ebb-tidal delta evolution can threaten public safety and lead to costly property or infrastructure damage. They do not “play by the rules” of our existing physics-based deterministic models.
Ebb-tidal deltas are highly nonlinear systems which can greatly amplify small instabilities[8], and hence produce disproportionate results.
In addition to the strict definitions of Phillips[5], ebb-tidal deltas are also “belligerent or intimidating, ruthless, and tough”, other traits reflective of badassery [Oxford Engish Dictionary]. The Columbia River ebb-tidal delta alone is responsible for dozens shipwrecks in the past century, and Ameland ebb-tidal delta has also featured numerous wrecks throughout its history.
Quoting Thomas Pynchon[9], Phillips also notes that badasses are “able to work mischief on a large scale”. Ameland ebb-tidal delta covers an area of approximately 100 square kilometers, roughly the size of The Hague. Many ebb-tidal deltas around the world are even larger!
Seriously?
Now admittedly, ebb-tidal deltas are just big piles of sand. A big pile of sand is probably not the first thing that comes to mind when you hear the word “badass”, unless you are Ralph Bagnold or a Sarlacc. This could probably also be considered gratuitous personification or anthropomorphization.
I’m sure that many of my friends and family have been scratching their heads as to why I would sacrifice the latter half of my 20s to understand them better. A critical reader might ask, “is it possible that you have only convinced yourself that ebb-tidal deltas are cool out of self-preservation?” And the answer is yes. Yes, I have. Nonetheless, I remain steadfast in my assertion that ebb-tidal deltas exhibit major symptoms of geomorphological badassery.
Although the concept of geomorphological badassery may seem silly at first, it illuminates several important truths of our (mis)understanding of these complex bathymetric features. Ebb-tidal deltas are important to study for reasons of coastal flood protection, navigational safety, and ecological value, but we are bad at predicting how they will evolve. This is because each ebb-tidal delta is unique, making it challenging to generalize their behavior. Furthermore, their chaotic, non-conformist behavior renders many of our usual deterministic prediction techniques ineffective. Lastly, the amplifying effect of highly nonlinear physical processes means that small physical changes (e.g., the development of a tiny shoal) could have disproportionately large consequences (e.g., relocation of a channel several kilometers wide). As such, badassery provides a useful conceptual framework for describing the challenges presented by ebb-tidal deltas to coastal engineers and scientists.
Three years ago, I experienced one of the highlights of my professional career so far. Alongside researchers from 3 universities, the Dutch government, and several other institutions, we carried out a 40-day field measurement campaign at Ameland Inlet in the north of the Netherlands. We deployed several frames loaded up like Christmas trees with every instrument imaginable: ADVs and ADCPs to measure waves and currents, LISSTs and OBSs to measure suspended sediment, a YSI multiprobe to measure salinity and other water quality indicators, and even a 3D sonar to track the migration of ripples along the seabed.
One of the five measurement frames that we deployed in Ameland back in Fall 2017. It was stacked full of instruments to measure the waves, currents, suspended sand and mud, salinity, ripples, and more.
Four of our five frames survived the relentless ebb and flow of the tide, and even two major storms (one of which left me stranded in Germany after the wind blew down all the overhead train power lines between Berlin and Amsterdam!). In the end, we obtained enough data to keep me busy for probably 3 PhDs, if not the rest of my career. This is just as well, since that last frame was buried in the storm, and based on our understanding of the local dynamics, it will likely re-emerge in another few decades, just in time for my retirement! I look forward to sharing my other findings with you here in the next few months!
Although it used to be the norm for scientists to squirrel away their data, there is an increasing movement towards open accessibility of research data. This improves transparency and accountability in the scientific process, and opens up new opportunities for collaboration. The data we collected is now available in its entirety here on the 4TU web portal or on Rijkswaterstaat’s interactive web viewer.
However, there is a lot of data – I mean A LOT! To help researchers interpret the contents of this database, we prepared an overview paper, which was finally published in the journal of Earth System Science Data! It is also accompanied by a more detailed report, which gets into the nitty-gritty details we didn’t have room to describe in the paper. Nobody likes to read a phonebook-sized report, but it’s nice to have the information there for the few brave souls who do want to comb through our dataset.
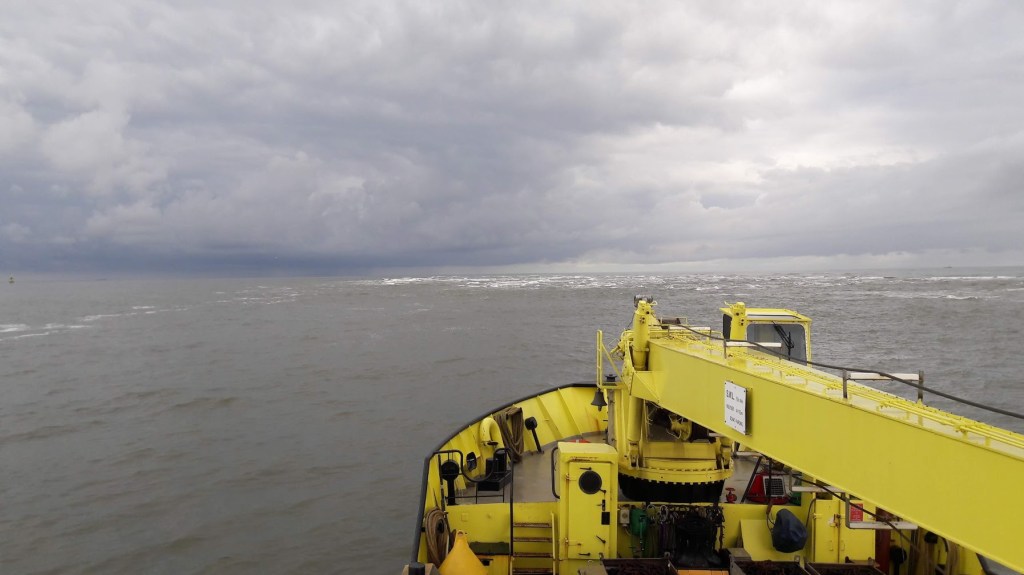
Sailing across the Vlie ebb-tidal delta on our way to retrieve the measurement frames at the end of the field campaign.
It was all a huge team effort, as evidenced by the 20+ co-authors. My contribution to this paper focused on the processing of the LISST and YSI multiprobe data, which tell us about the size of particles floating through the water, and how salty that water is. I also designed the maps. As a kid, I loved to read and draw maps, and I think that 7-year-old Stuart would have been tickled to know that he would still be dabbling in cartography all these years later.
As the research in the rest of my PhD (and beyond!) will continue to focus on the fruits of this measurement campaign, I am very keen to work together and collaborate with other researchers who have an interest in this dataset. Please get in touch if you are interested!
Today’s sand sample is from Clatsop Beach, Oregon, on the Pacific Northwest coast of the US. Last summer I spent several months modelling sediment transport at the mouth of the Columbia River with the US Geological survey, and had the great privilege of making a site visit at the end of my stay.
Working in partnership with Oregon State University and the Washington State Department of Ecology, I assisted with a topographic survey of the beaches surrounding the Columbia. Half the team surveyed the submerged parts of the beaches via jetski, and my group walked transects across the beach and up the dunes using backpack-mounted GPS units.
Starting at far-too-early-in-the-morning, our team split off individually, and I had an entire kilometers-long stretch of the beach to myself until almost lunch time, when we reconvened. I love long walks on the beach and take great pleasure in that sort of solitude in nature, and it was even cooler to do that while collecting data that could help the project I was working on. The digital computer model I had worked on all summer was now suddenly a real place where I could feel the sand between my toes.
Gold in Them Hills
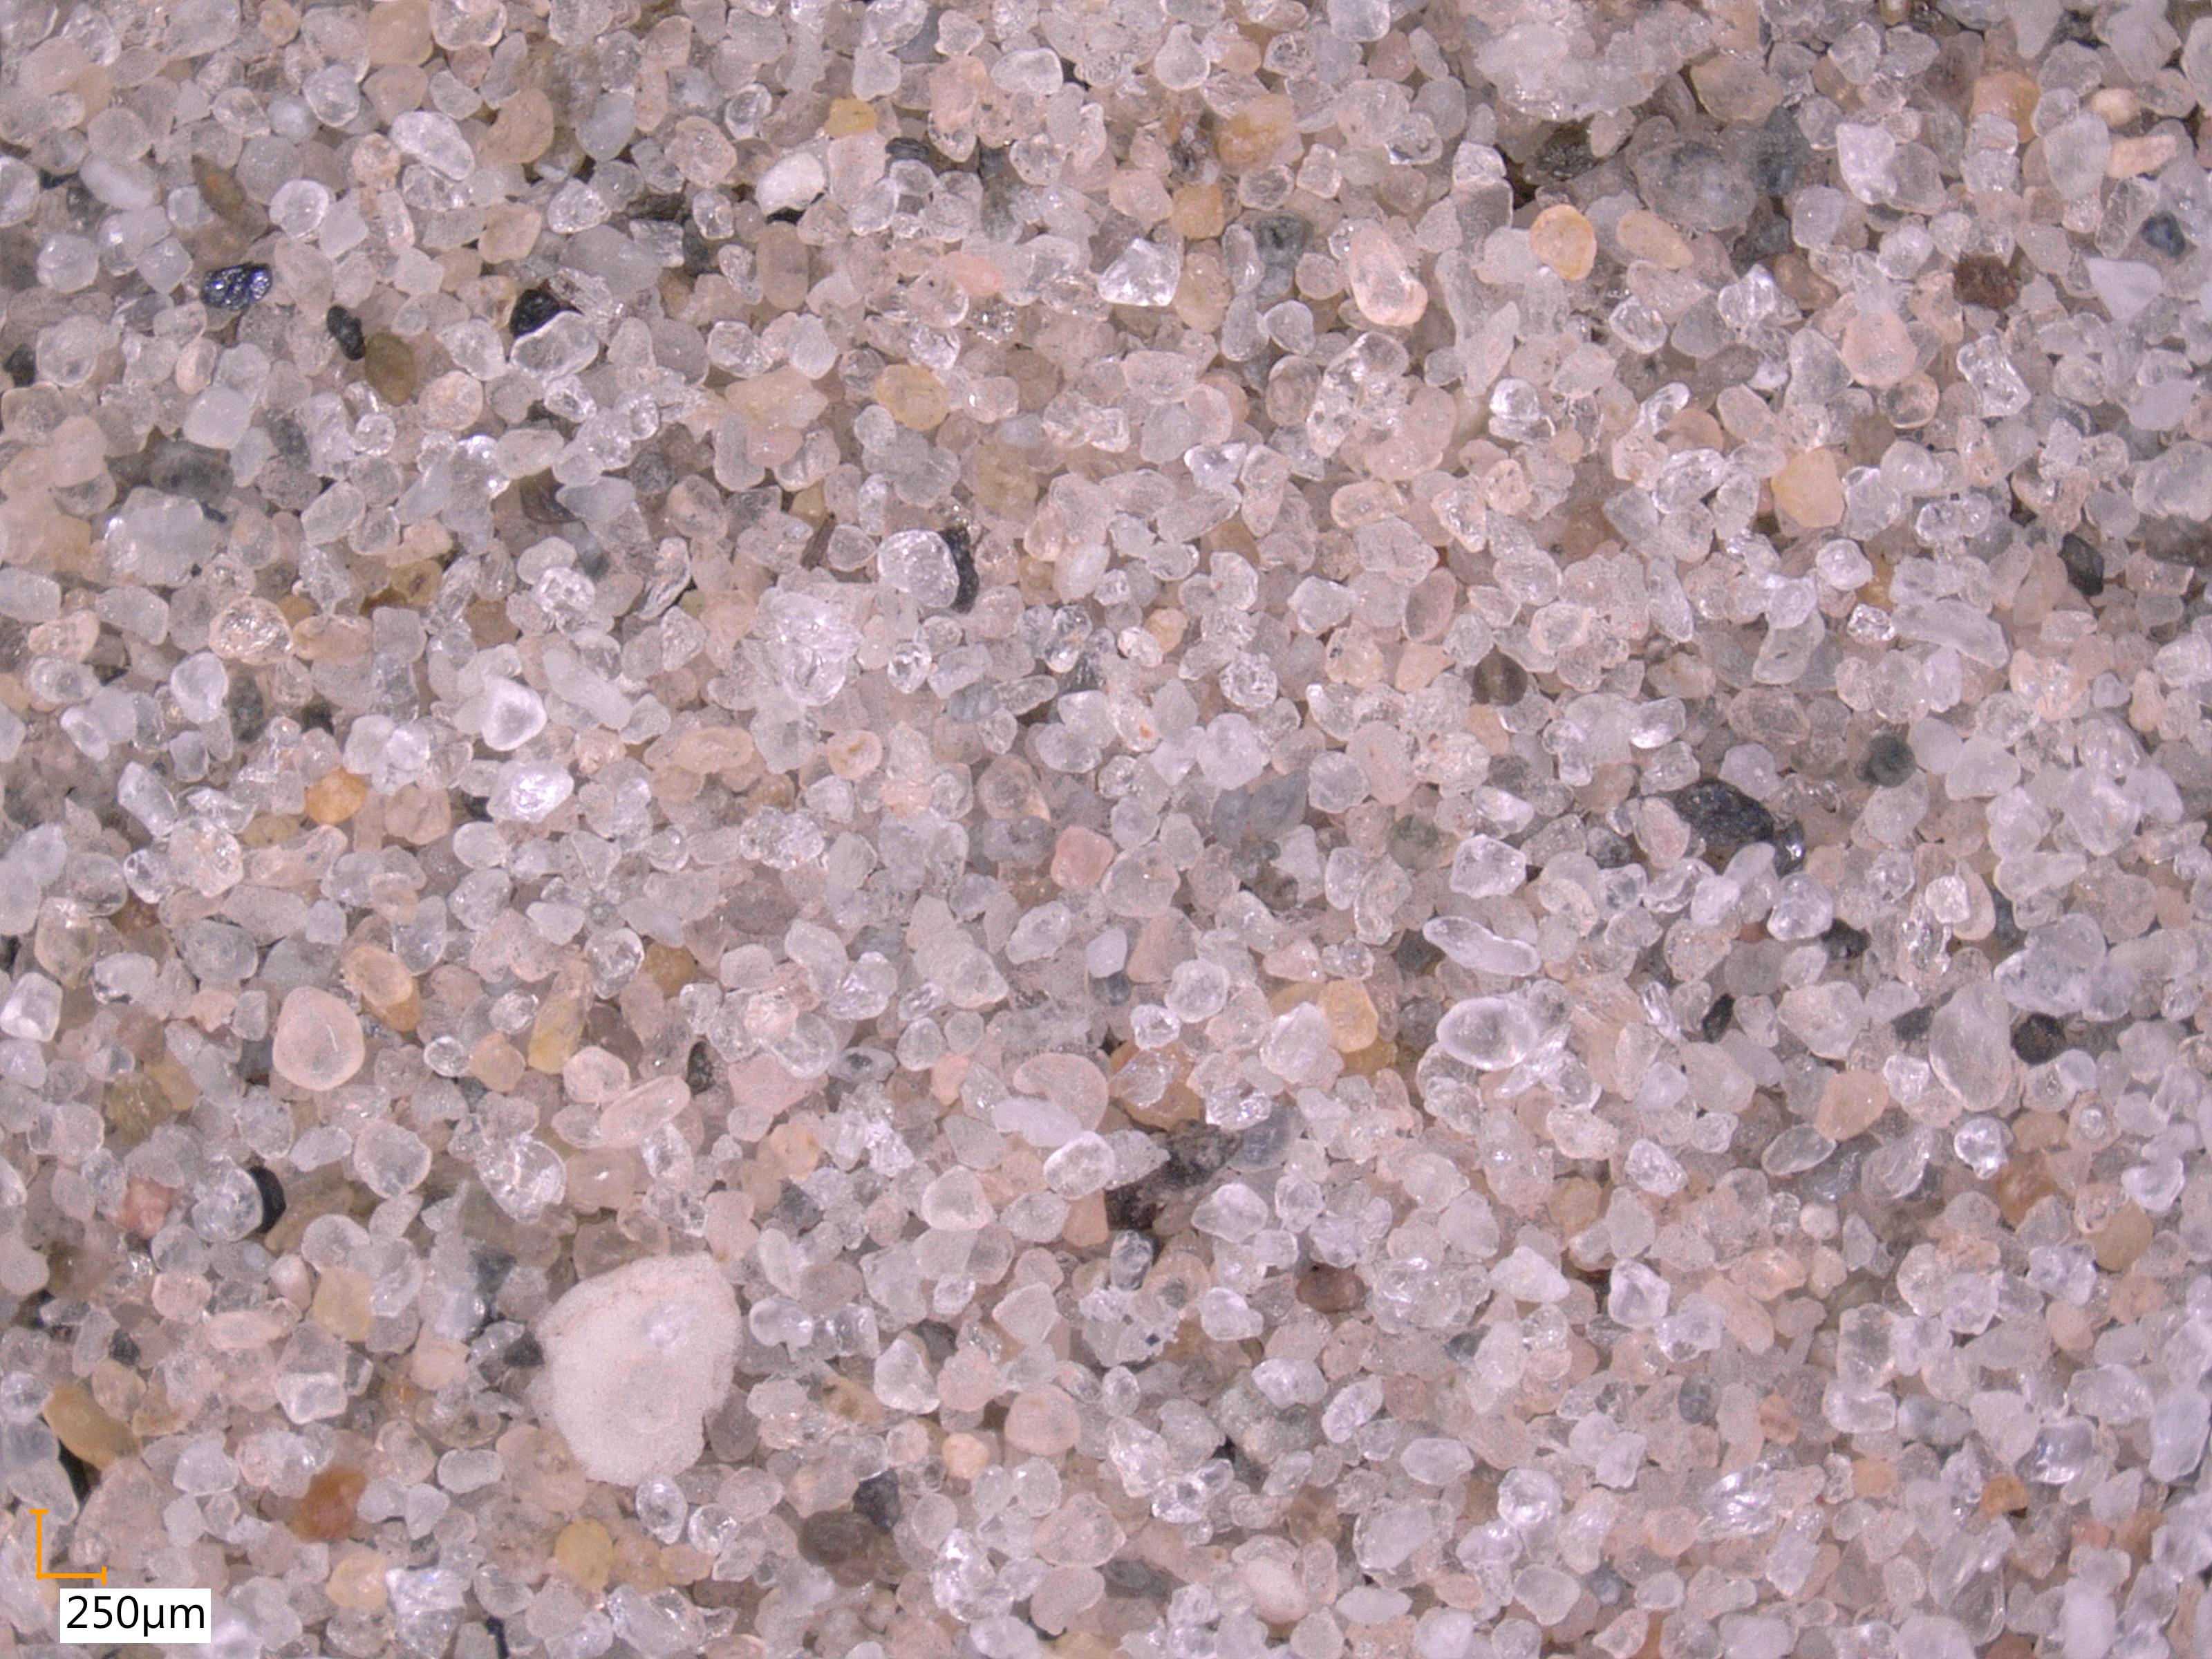
The sand at this beach is interesting because of the black grains we see scattered throughout. This sediment is made of minerals like chromite, magnetite, and garnet, which are heavier than the whitish quartz grains we see around them. These deposits, known as “placers”, were transported to the sea from the mountains inland by the Columbia River. They form on the beach because lighter minerals like quartz are preferentially sifted out by waves and currents, leaving more of the dense particles behind. This even includes trace amounts of gold! Can you see any in the photograph below?
Sediment sample from Clatsop Beach, OR. Note the black “placer” deposits of heavy minerals. Can you see any flecks of gold?
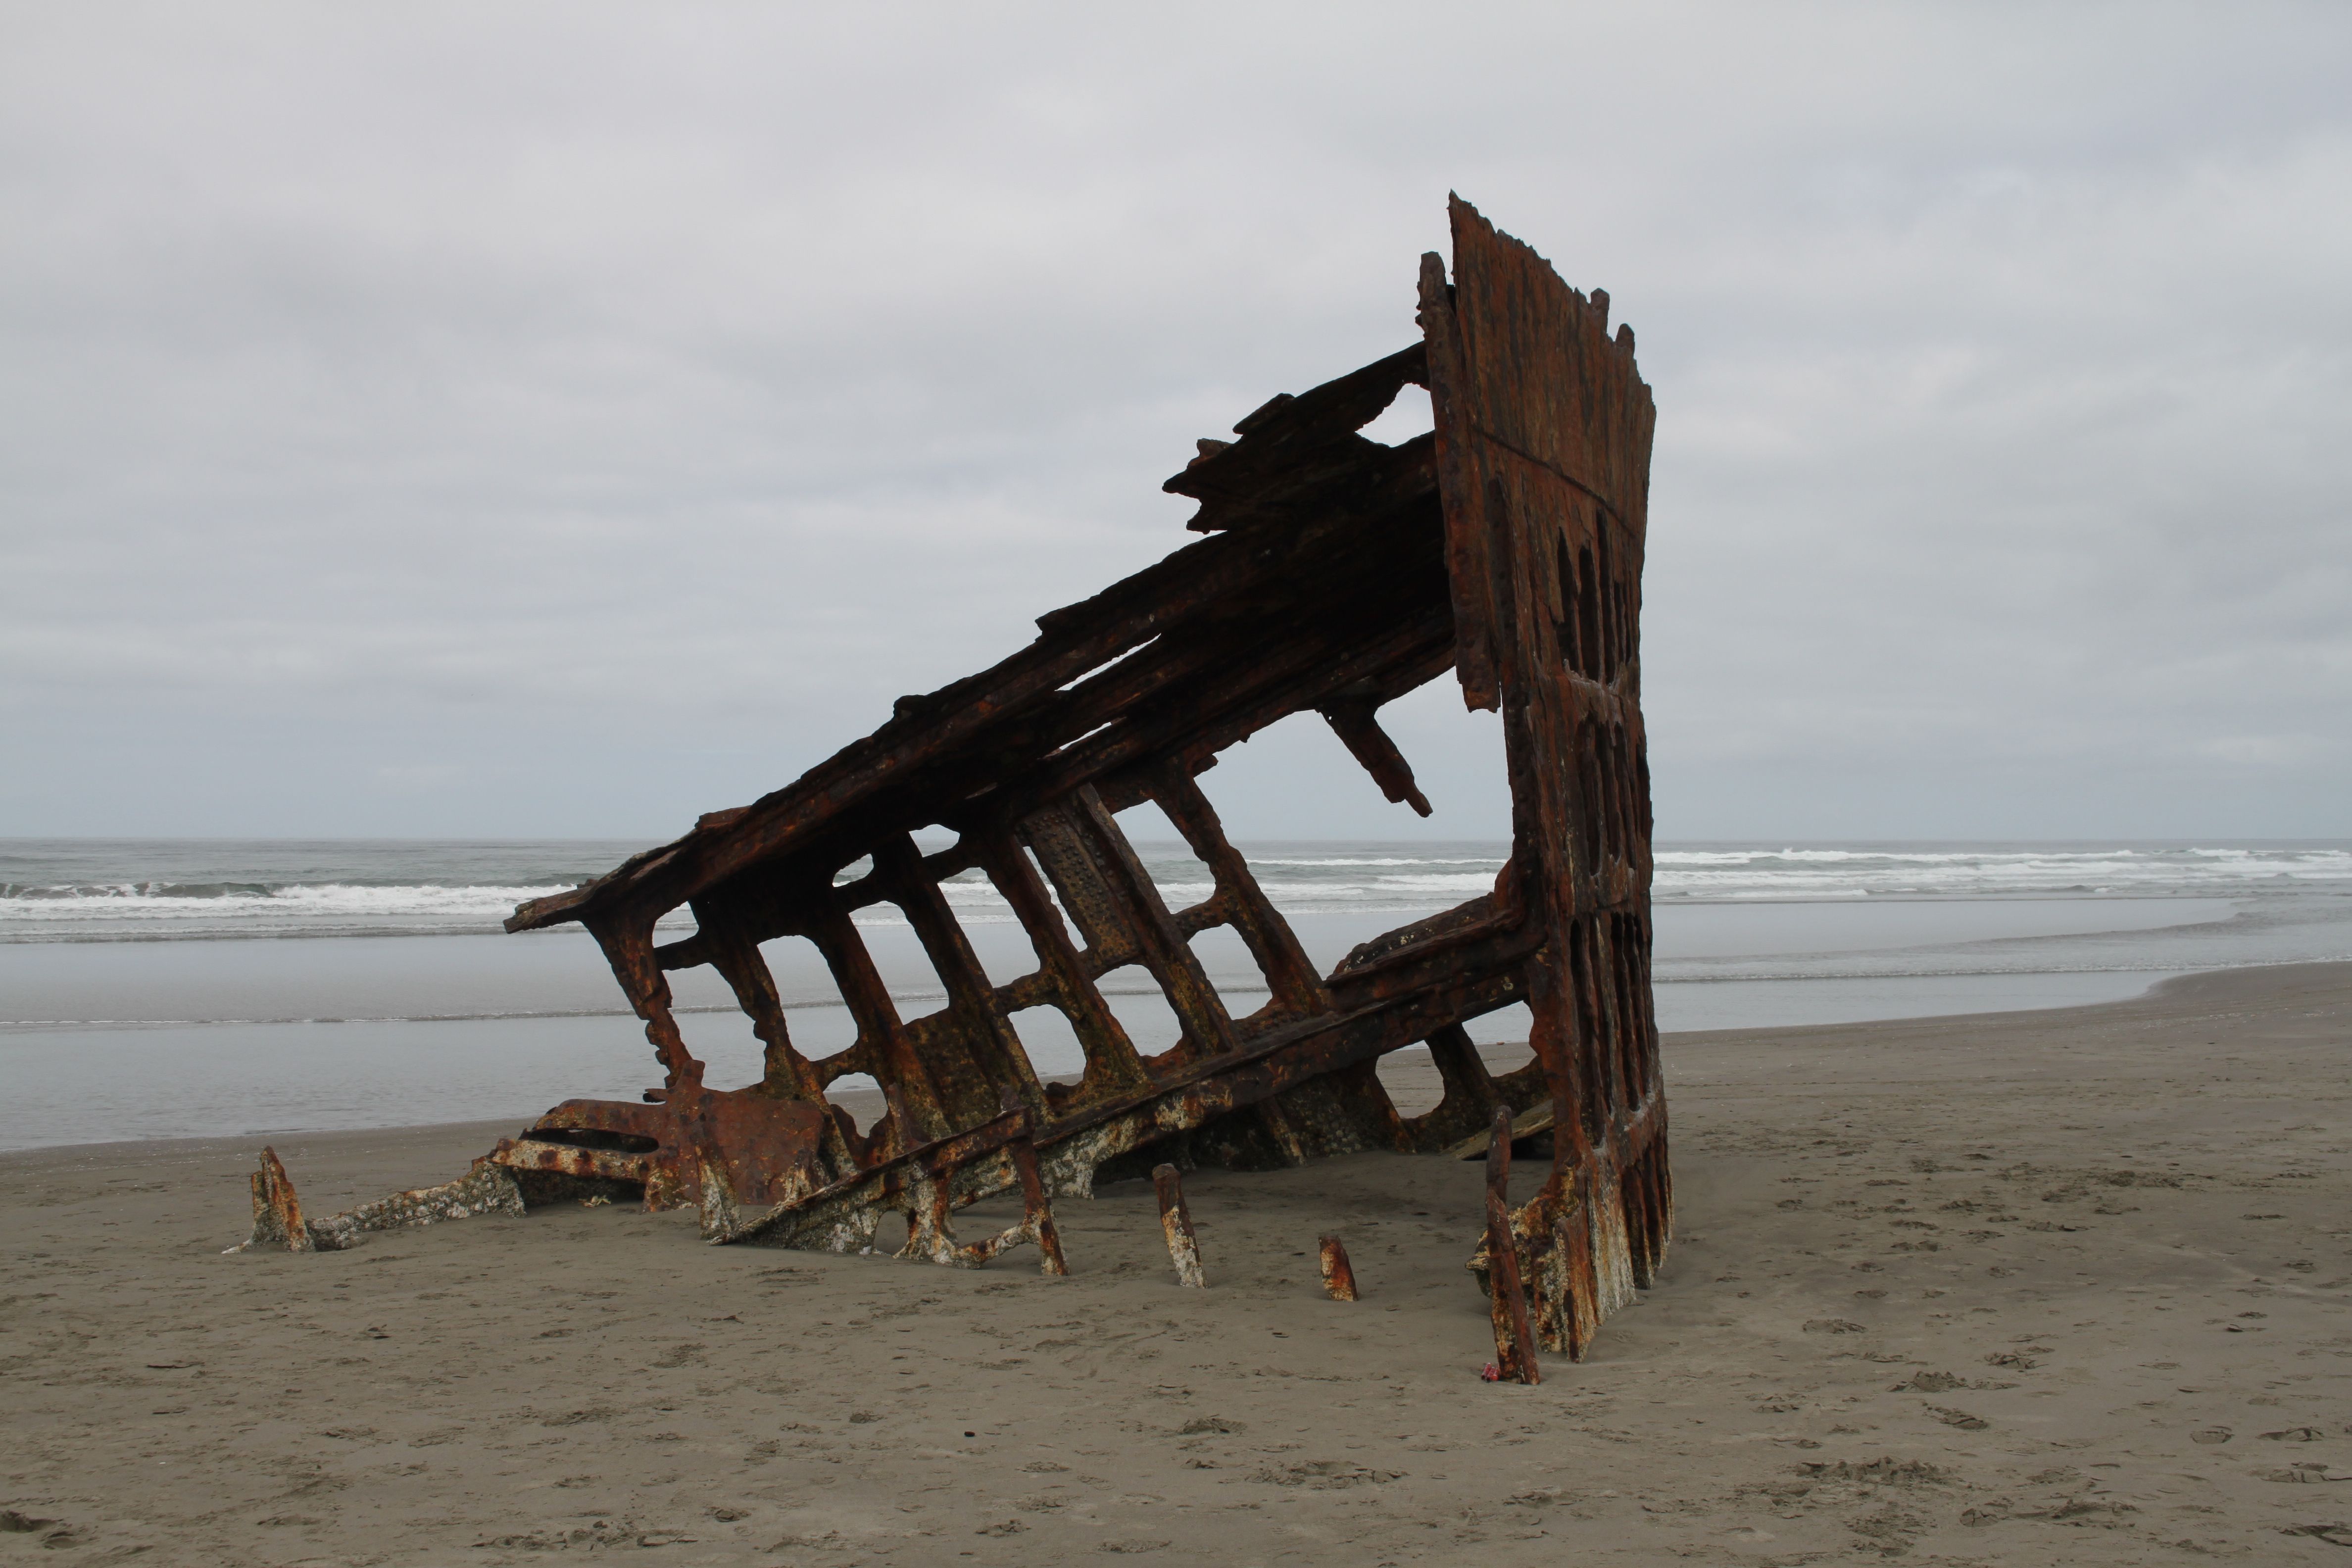
At the end of our survey, I walked along the beach to check out a surprising object emerging from the sand: the wreck of the Peter Iredale, a sailing ship that ran aground there in 1906:
The Wreck of the Peter Iredale on Clatsop Beach.
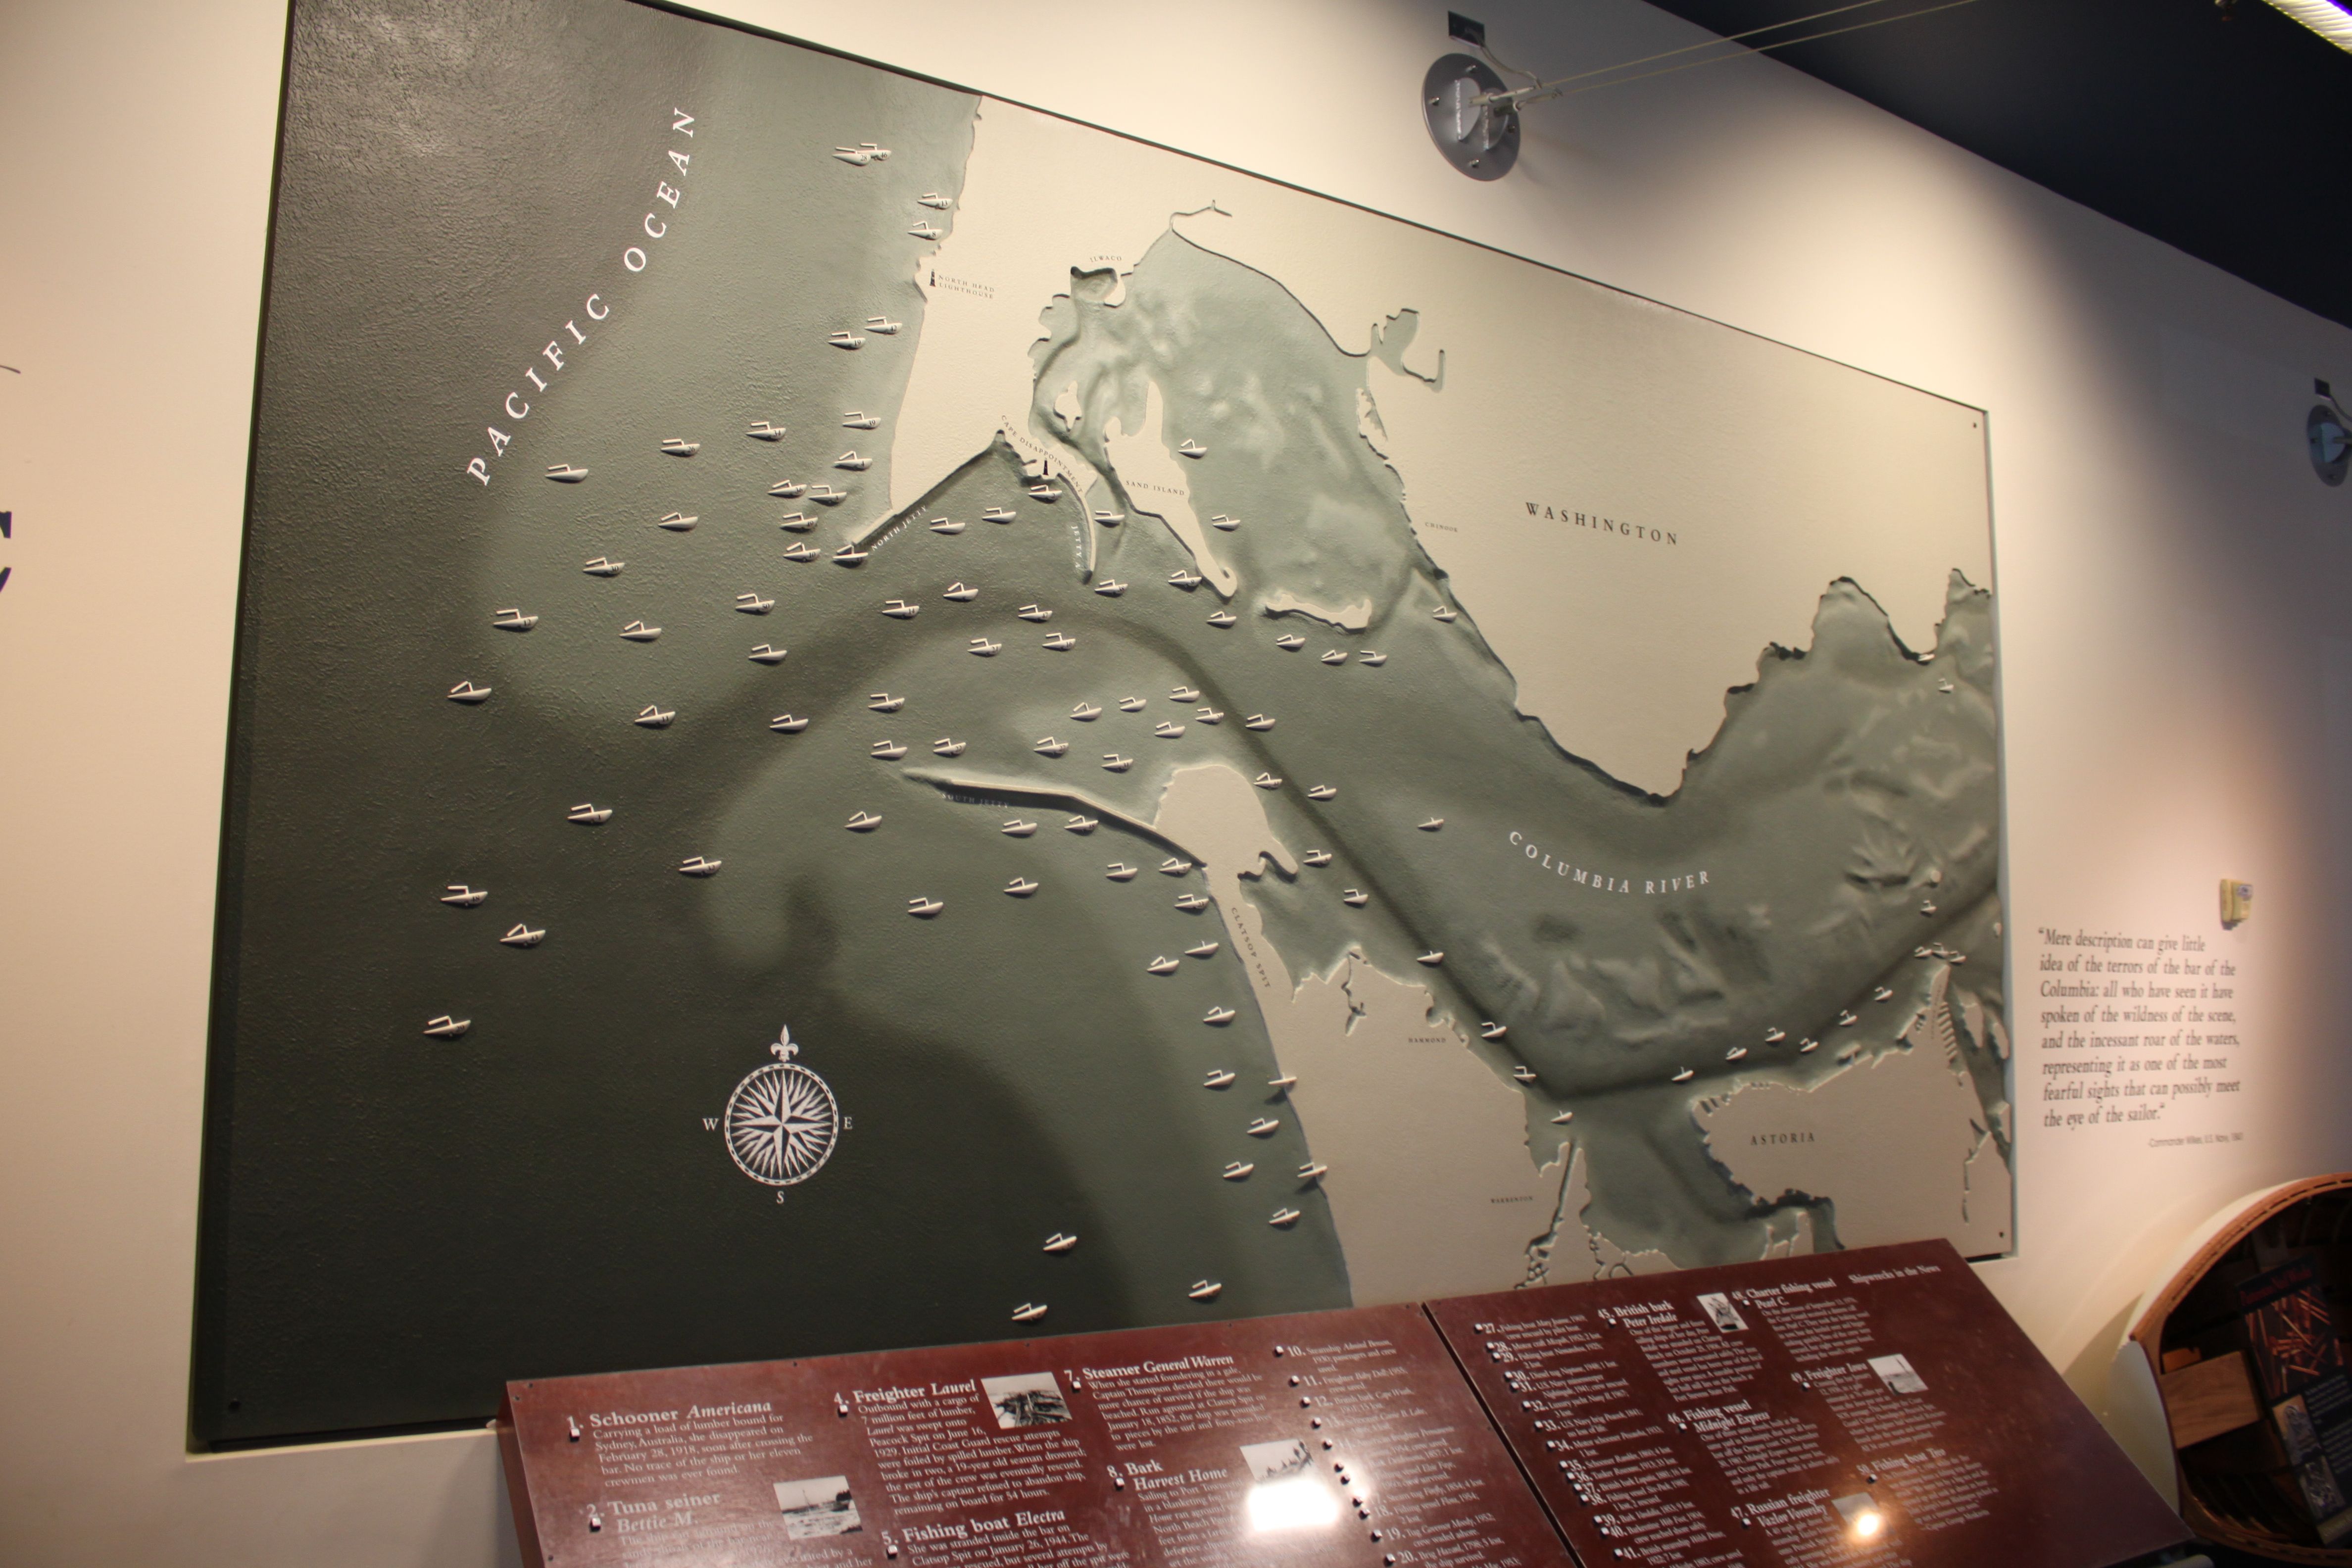
Known as the “Graveyard of the Pacific“, the mouth of the Columbia is truly a “killer ebb-tidal delta”: huge waves and powerful currents meet violently, and have caused dozens of shipwrecks over the past few centuries. This makes effective management of the sediment there crucial for safe navigation, keeping the shipping channel dredged clear and disposing of the sediment in environmentally-friendly, cost-effective, and useful ways.
Historical shipwrecks at the Mouth of the Columbia River, seen in the Columbia River Maritime Museum.
Strategic placement of this dredged sediment was the focus of my time at USGS last summer, but I will delve into that more in a future post!
The main protective barrier for the Netherlands against the threat of flooding from the sea is a row of colossal sand dunes and wide beaches that stretch the length of their coast. However, that barrier is not completely natural — since the Dutch coast is in a constant state of erosion, the sand in their coastal zone has to be continually replenished. This replenishment takes the form of nourishments, which are essentially just massive piles of sand placed on beaches, dunes, or just offshore. The Dutch are lucky, since the bottom of the North Sea is covered in sand for hundreds of kilometers in every direction, meaning that there is a ready supply available for this purpose.
Although we still have plenty to learn about how to construct these nourishments effectively and in an environmentally friendly way, we are starting to get the hang of it — at least for long, straight, sandy coastlines like in Holland. However, this all gets a bit trickier when we turn our attention to the Wadden Islands dotting the northern coast of the Netherlands. These little islands sit between the stormy North Sea and the shallow Wadden Sea, a large estuary whose ecological value is unmatched in the Netherlands.
The coast of these islands is punctuated by a series of inlets connecting the two seas. Chaos reigns at these inlets, where strong tidal currents pass in and out, clashing with waves and whisking sandy shoals in and out of existence in unpredictable ways. This makes the inlets treacherous for ships, but also a challenge to simulate with our computer models and design nourishments for.
How, then, are are we meant to nourish the coast of these islands? We want to keep their inhabitants (and those on the nearby mainland) safe from flooding, but also need to be careful about inadvertently disrupting the vital ecological habitat of the Wadden Sea.
To answer that question, the Dutch government initiated the Kustgenese or Coastal Genesis project. In collaboration with several Dutch universities, companies, and research institutes, they set out to better understand how these tidal inlets work, and whether it is possible to effectively nourish them. The project focuses on Ameland Inlet, which is located between the islands of Ameland and Terschelling.
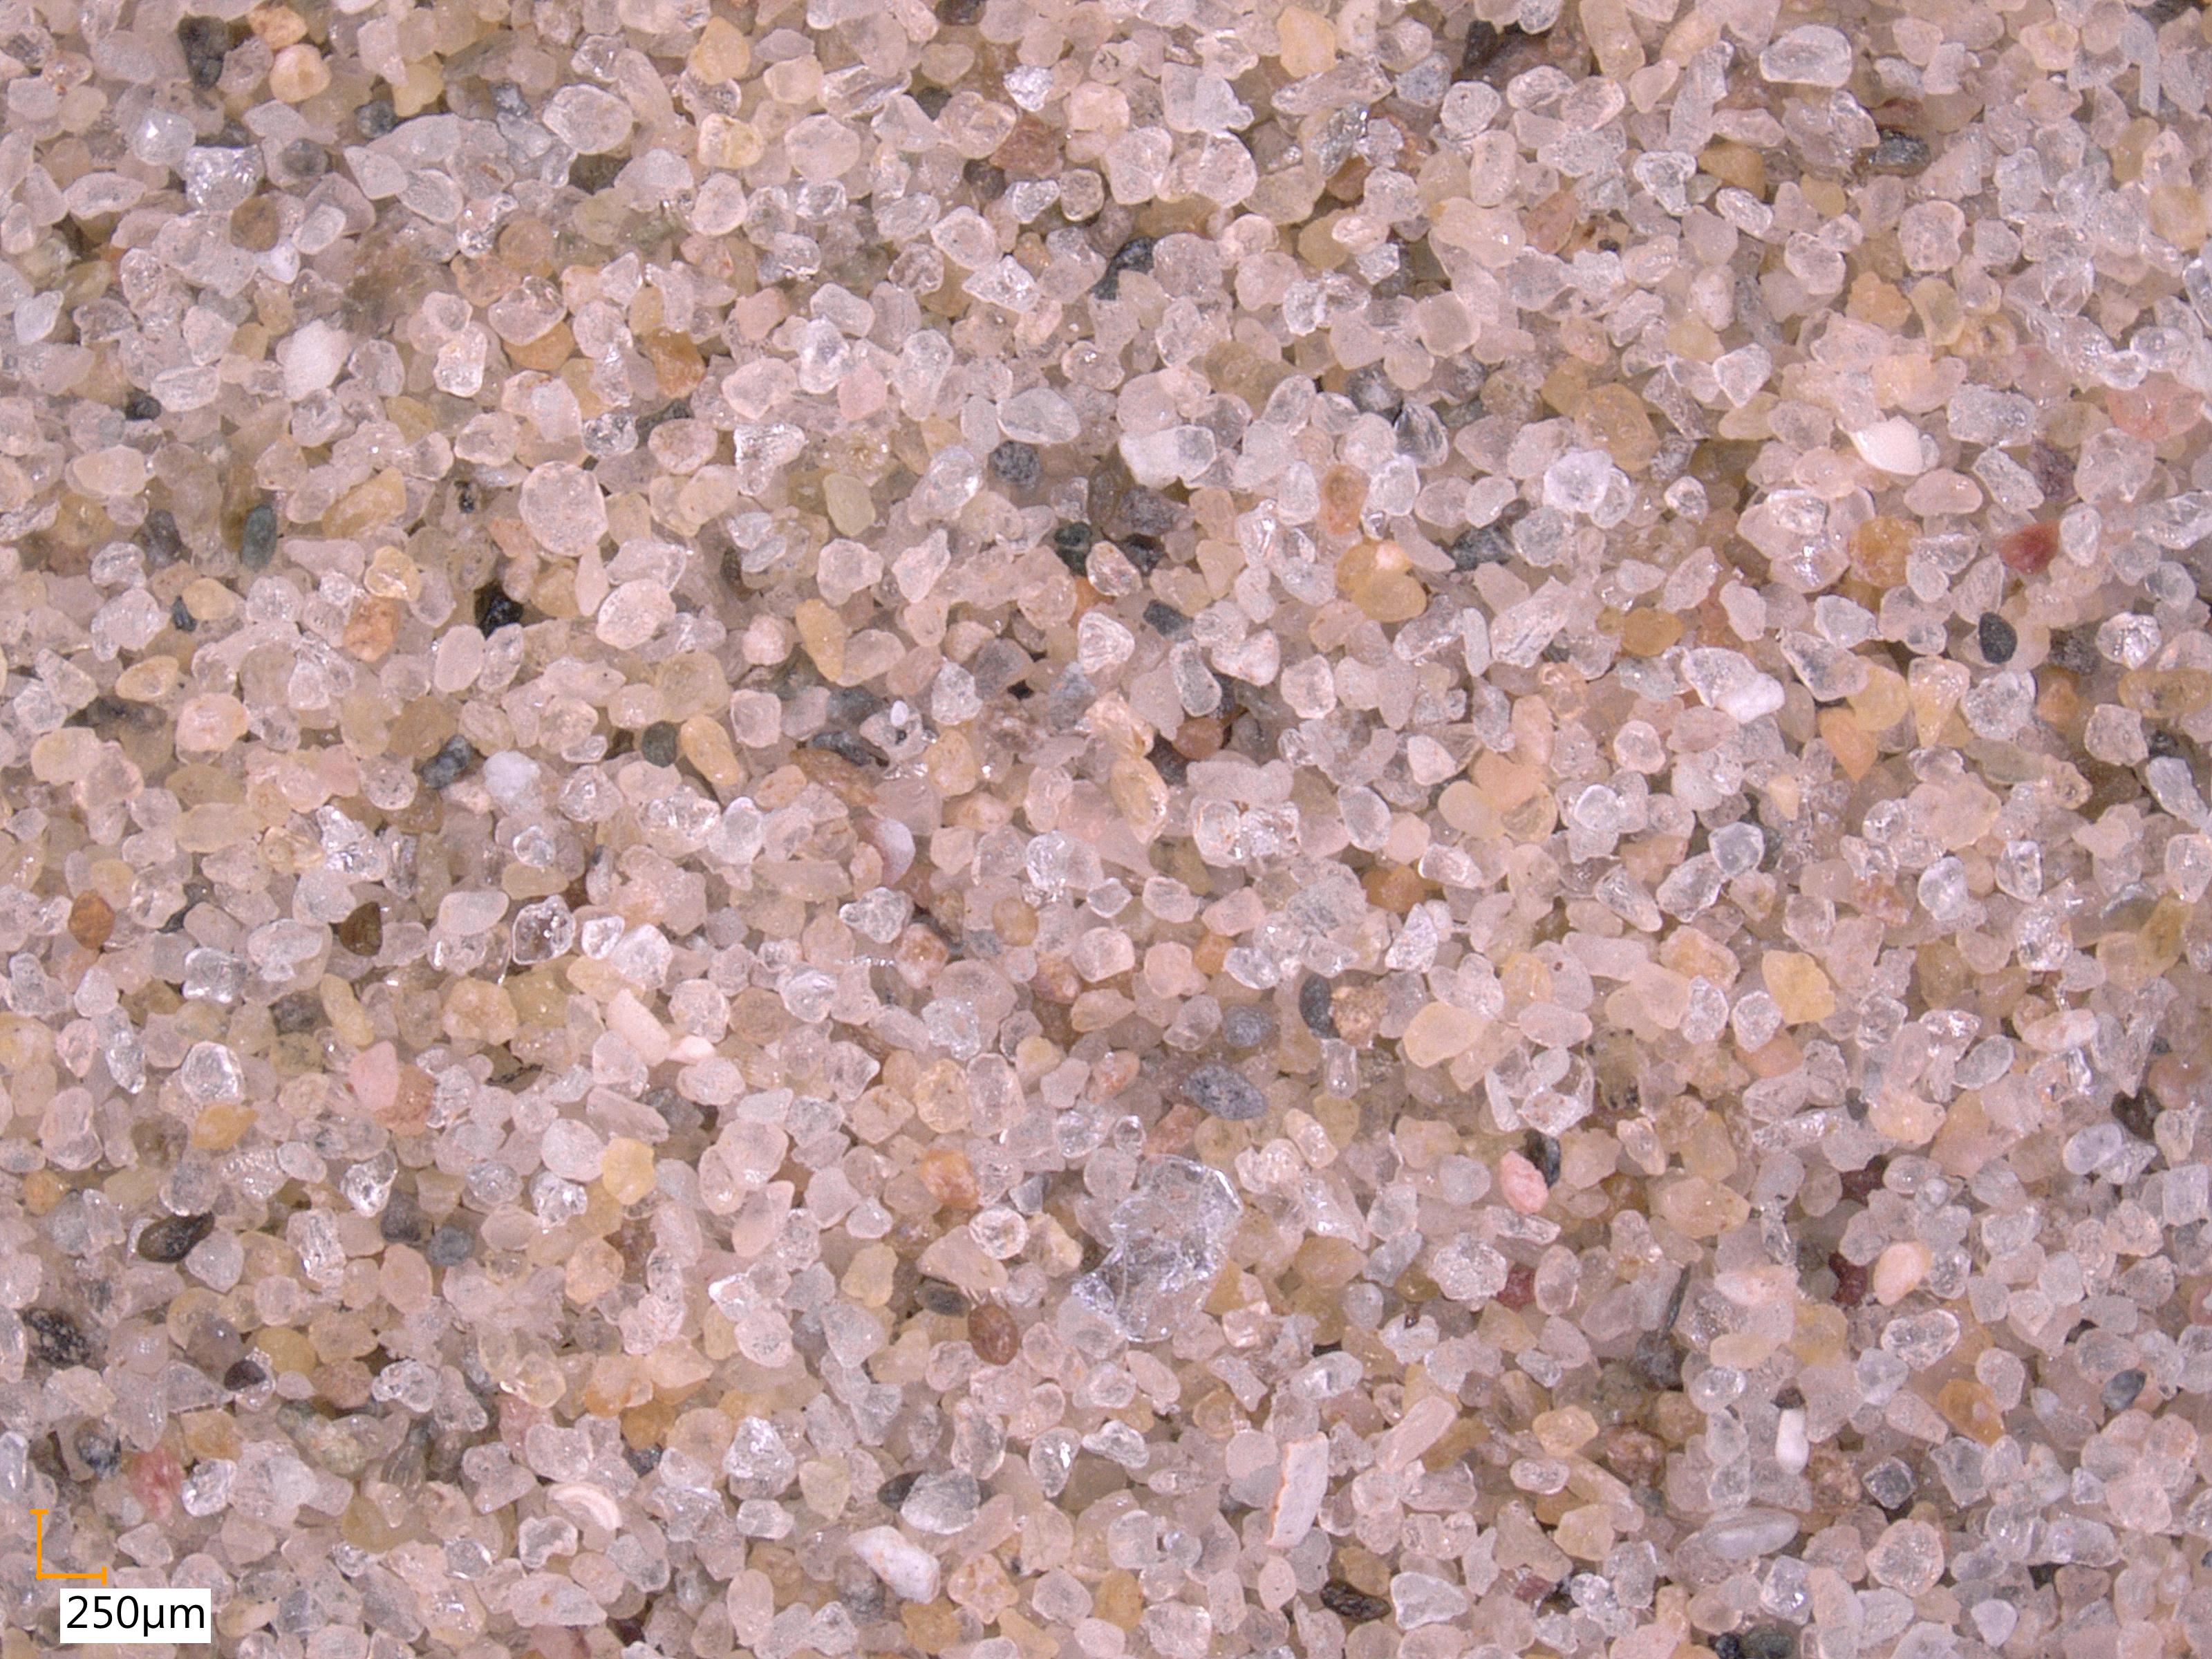
My PhD project is but a very tiny piece of the very large Kustgenese pie. My goal is to figure out specifically how the size of sand grains affects the paths that they take around tidal inlets. It has been the dream job for someone who has loved playing in the sand ever since he was a little kid. As a result, it has entailed a lot of time at my computer and in the laboratory, investigating the characteristics of the sand in Ameland inlet (that’s also why I have so many pictures of sand on this blog- we have a really cool microscope!). It is very fine sand and would be absolutely perfect for squidging your toes through on a hot day — if it weren’t at the bottom of the sea, that is:
Native sediment from Ameland ebb-tidal delta
In the spirit of ‘why not?’, the Dutch government decided that the best way to test whether nourishments would be effective in this environment was to just go ahead and try one out last year. They dredged up 5 million cubic metres of sand (that’s enough to fill 3 Skydomes, for anyone reading this back home in Toronto) and placed them just outside the inlet. A few months ago, one of the Dutch government officials showed up at a meeting with a “present” for me… some sand from the nourishment!
Nourishment sediment dredged from offshore and placed on Ameland ebb-tidal delta.
Needless to say, I was very excited. At first glance, it appears quite similar to the native sediment, so that means it should behave in a similar manner. Time will tell how the nourishment evolves- we are watching very closely!