Here is another sample brought back by my friend Claudia, from Dunkirk Beach in northern France. Dunkirk is famous from the Second World War, when the Nazis had cornered Allied troops there and forced a major evacuation across the English Channel.

This is where my inner history nerd and my inner sand nerd collided to ask an interesting question: is the sand on that beach now (and in the photograph below) the same sand that was on the beach during the famous evacuation? There’s no easy answer to that question, but as it so closely relates to the main research questions of my PhD, I can’t resist indulging in such a thought experiment. Shall we try together?
To answer this question, let’s ask ourselves a few things:
- What kind of sand is on the beach?
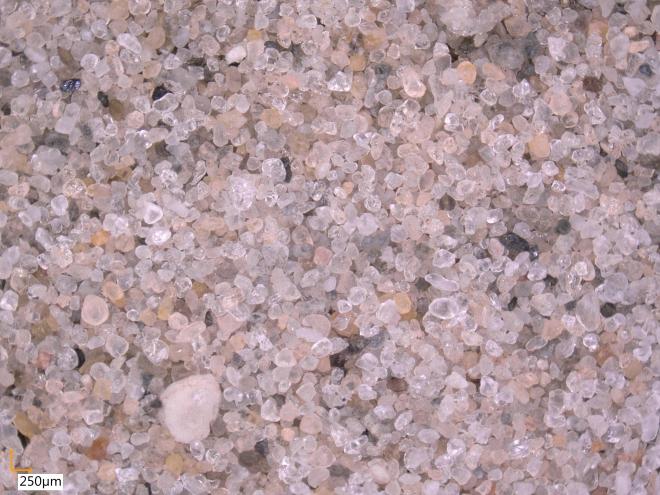
The size of the sand grains will determine how easily it is moved around by the waves and tides. Bigger particles require more energy to move, and are thus more likely to stay where they are. In general, smaller sand grains are more likely to get picked up and transported far away*. Based on the photo above, let’s assume that most of the sand grains are about 200 μm in diameter (that’s 0.0002 m).
The sand also seems to be mainly made of clear or white-brownish grains, so we can probably make a safe guess that they are mainly made of quartz. This will come in handy later if we need to make an assumption about how dense the particles are. Most of this sand comes from large sand banks offshore, which is moved to shore by waves during large storms [1]. - How do waves and tides shape the coastline here?
To predict how sand moves around on a beach, we need to understand the behaviour of the water there. The tidal range on this part of the French coast is quite large, between 5-8 m [1]. That large range means that a correspondingly massive volume of water is moved back and forth past the beach twice a day, which generates powerful tidal currents. Waves here mainly come from the English Channel to the west or the North Sea to the northeast, and are generally at their strongest during occasional winter storms. - In which direction does the sand usually move?
There are several possible fates for our 1940 sand: (a) staying where it is, (b) moving offshore into the English channel, (c) moving westward towards Calais, (d) moving eastward to Belgium, or (e) moving onshore to build up the sand dunes there.
At these beaches, the tidal currents moving eastward towards Belgium are slightly stronger than the ones moving westward back towards England [1]. This is eastward motion is reinforced by waves and wind-driven currents, which also tend to move eastward on average [2]. As a result, the sediment effectively takes two steps forward and one step back, gradually moving in an eastward direction (i.e. (d) rather than (c)).
We also know that there is a regular supply of sand from offshore [2], so let’s rule out (b) for simplicity. The dunes in that area are also relatively stable [2], so let’s rule (e) out, too. If most of the sand is then either moving east (d) or staying put (a), what is the likelihood that our 1940 sand is still there? - Have humans intervened with the coast there?
In 2014, the French government created the largest sand nourishment in the history of France on the beach at Dunkirk [3]. This is visible in Google Earth as the giant pile of sand near the red pin (below). If there was still 1940 sand on the beach there, it is now likely buried underneath the nourishment. Depending on where my friend collected her sand, there is a good chance that it is made up of this sand that was dredged from the nearby harbour, rather than sand that was on the beach in 1940.
I had a similar issue with my tracer study: several months after our investigation, the Dutch government placed a huge nourishment right on top of our study site. That means that even if some of our tracer sand is still out there, it is likely buried deep beneath a giant pile of sand, which means that we can’t go back there to take more samples. - What is the likelihood of sand leaving the beach?
After placing the nourishment at Dunkirk in 2014, scientists monitored how the beach changed, and found that it lost 9% of its volume in 2 years [3]. Most of this sand appeared to migrate eastward, as predicted by those other studies. If we had similar data about how much the volume of the beach has changed in the past 80 years, we could estimate the rate at which sand is leaving, and hence how likely it is to still be there. From that, we could come up with a sort of “residence time”: how long we expect sand to remain on the beach given the volumes that are coming in from offshore sandbars and leaving down the coast. That would at least give us a ballpark idea of what to expect. We could also use computer simulations to more precisely predict this transport, but that’s a lot of work for our little thought experiment!
Given all of this information, I would guess that most of the sand that was on the beach in 1940 is somewhere on its way to Belgium, or is still there but buried beneath the new nourishment. Based on the assumptions that we made about this being quartz sand about 200 μm in diameter, we can estimate that in a handful of sand (say, 250-300 mL), there will be about 5 million individual grains!** If we scale this up to an entire beach, then I think the odds are good that at least a few grains have stuck around since then.
There are lots of different ways that you could go about this, though- how would you try to tackle it? Am I missing anything important?
* This “smaller-particles are more likely to get picked up by the waves and currents” rule only works for sand grains that are all more-or-less the same size. If your sand has both large and small particles, you can also have “hiding” effects where little grains of sand hide behind big grains and are harder to move. And don’t even get me started on mud! Mud particles (usually 10-100 times smaller than sand) obey a whole other set of complicated rules that are frankly a little absurd sometimes. But these are discussions for another time…
** Even though the grains in that picture are clearly a bit irregular in shape, we can pretend that they are spheres and calculate their volume Vgrain = 4/3π(0.0002/2)3 = 3.3×10⁻¹¹ m3. The volume of your hand Vhand is 300 mL = 3×10⁻⁴ m3, so we can calculate the number of grains as Vhand /Vgrain, which is about 9 million. But wait! We have to account for all the spaces in between the sand grains, since we’re not dealing with a solid block of quartz. This is usually about 40% for sand, so this is how we get our final number of about 5 million.
[1] Sabatier, F., Anthony, E. J., Héquette, A., Suanez, S., Musereau, J., Ruz, M. H., & Régnauld, H. (2009). Morphodynamics of beach/dune systems: examples from the coast of France. Géomorphologie: relief, processus, environnement, 15(1), 3-22.
[2] Anthony, E. J., Vanhee, S., & Ruz, M. H. (2006). Short-term beach–dune sand budgets on the north sea coast of France: Sand supply from shoreface to dunes, and the role of wind and fetch. Geomorphology, 81(3-4), 316-329.
[3] Spodar, A., Héquette, A., Ruz, M. H., Cartier, A., Grégoire, P., Sipka, V., & Forain, N. (2018). Evolution of a beach nourishment project using dredged sand from navigation channel, Dunkirk, northern France. Journal of Coastal Conservation, 22(3), 457-474.