It’s February, which means it’s Coastal Dynamics season again! 5 years ago (time flies!), I first arrived in the Netherlands as part of my master’s program. I walked into the classroom for Judith Bosboom’s Coastal Dynamics 1 course, and it really changed everything for me. CD1 felt like the course I had been waiting for all my life, combining geology, geography, physics, and practical engineering all in one package. The course was also so well-taught and structured that it seemed like an IV drip of knowledge, pulsing straight to your brain. I felt like I was truly in the right place and coastal engineering was the field for me. It cranked my enthusiasm for all things coastal to 11.
After I became a PhD student, I began TAing the course and learned what it was like on the other side of the classroom. This revealed a hitherto unsuspected enthusiasm for teaching (although perhaps it shouldn’t have been a big surprise, given that I come from a large family of teachers), and has been a big factor in my interest to stay in academia.
Every year, we start the course by showing students the video “River of Sand”, which explains coastal sediment transport in an easily understandable way. This video is 55 years old now, but it still does a better job of explaining how beaches work than almost anything else I’ve seen. I hope you enjoy it as much as we do!
Growing up in Canada, we were always taught that the Bay of Fundy, is home to the world’s highest tides. The difference between the highest high tides and lowest low tides is 17.0 m, plus or minus 0.2 m [Arbic et al., 2007]. When I was younger (long before I ever knew that coastal engineering was a career option), I had the good fortune of visiting the Bay several times, usually while en route to visiting my Mom’s family in eastern Canada.
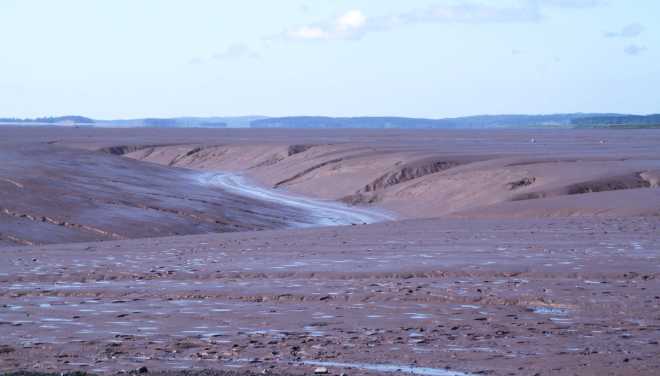
When the tide retreats, tidal flats stretch for tens of kilometers, making you question which direction the ocean is actually in. The Hopewell Rocks (pictured above) are revealed, and tourists wander the base of beautiful red cliffs. Then right on schedule, the tide returns, and everything is bathed deep in chocolate milk for 6 hours.
Massive tidal gullies on the mudflats of the Bay of Fundy, near the Hopewell Rocks. Photo: Stuart Pearson.
However, 1600 km due north of Fundy lies Ungava Bay, which is also fighting for first place in the World’s Highest Tides Competition. Flanking Hudson Strait (which connects Hudson Bay to the Atlantic Ocean), Ungava Bay has a maximum tidal range of 16.8 m, plus or minus 0.2 m [Arbic et al., 2007]. This means that the difference between the Bay of Fundy and Ungava Bay is so small that it is within the limits of what we can measure- the jury is still out!
How do the tides grow so large in these bays? The answer is resonance. Tides generated by the gravitational pull of the moon rise and fall every 12.4 hours (one tidal period). By coincidence, the time it takes a tidal wave (i.e. one full cycle of low water to high water and back to low water) to travel the length of Ungava Bay is 12.7 hours [Arbic et al., 2007]. This means that a new tidal wave is coming into the bay just as the old one is coming out. If you push a child on a swing, they will travel much higher if you properly time your pushes with the rhythm of their swinging. The same holds true with tides moving in and out of a bay, and we call this phenomenon resonance.
The speed at which a tidal wave travels depends on the depth of the water, the shape and size of the bay or estuary it moves through, and friction from the seabed. The consequence of this is that changes like sea level rise and the construction of tidal power stations or storm surge barriers can actually modify the behaviour of the tides. For instance, an increase in sea level rise could bring Ungava Bay even closer to that 12.4 hour resonant period, and further increase the tidal range there [Arbic et al., 2007]. However, this would require 7 m of mean sea level rise to increase the tidal range by just 2%, which I think would be a much bigger problem…
Usually friction from the seabed is one of the main factors that affects tidal waves in estuaries, dissipating energy and damping out their range. However, a recent study by my TU Delft colleagues Kleptsova & Pietrzak [2018] found that friction at the surface of the water from sea ice can also have a moderating effect on tidal amplitude. As a consequence, the tidal range in the far-north Ungava Bay actually decreases during the winter. This suggests to me that Fundy remains the World Champion at Christmas, but that during the summer, it’s still anybody’s guess.
An interesting question (and the one that sparked my curiosity to write this post in the first place) then becomes: how might our tides change in a world where the Arctic no longer fully freezes over? To me, this is just one more example of the scary Pandora’s Box that humanity has opened with rapid climate change. If something as seemingly dependable as the tides can change, what other surprises will nature have in store for us?
This week we have some sand from Cannon Beach, Oregon, which is most famous for this big, beautiful rock:
Haystack Rock on Cannon Beach, Oregon.
Located on the Oregon coast just south of the Columbia River mouth, I passed through Cannon Beach last summer on my drive to Vancouver.
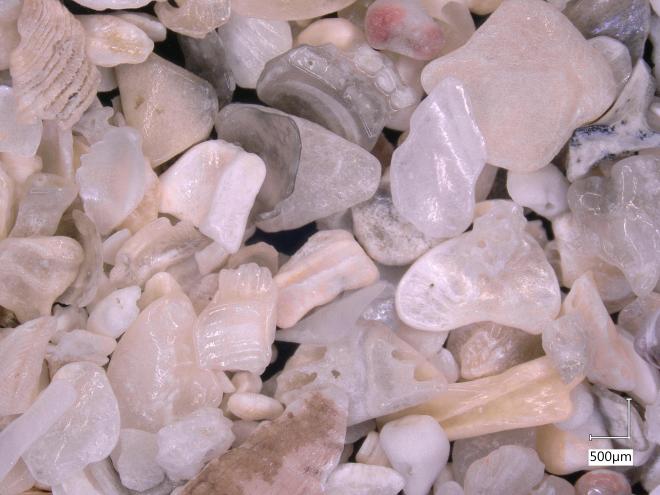
The most peculiar thing about this sand was that it squeaked when I walked on it. You read that correctly- it made a squeaky noise when you stepped in it, which was a delightful surprise. I had heard about this phenomenon before, but never experienced it myself. “God, that’s weird!” says one Youtuber after running their hands through the sand at Cannon Beach:
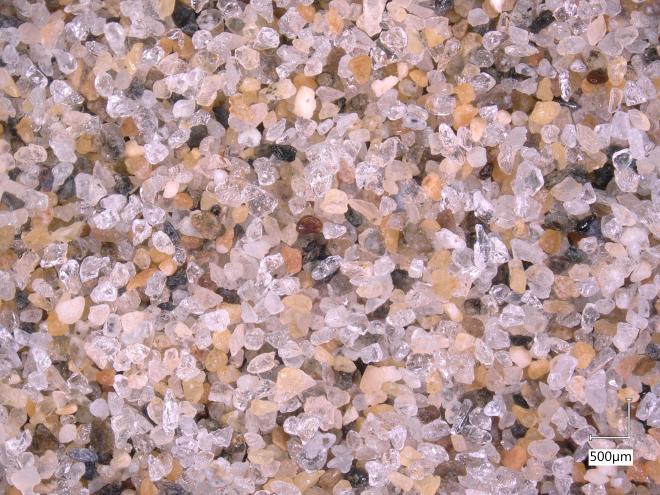
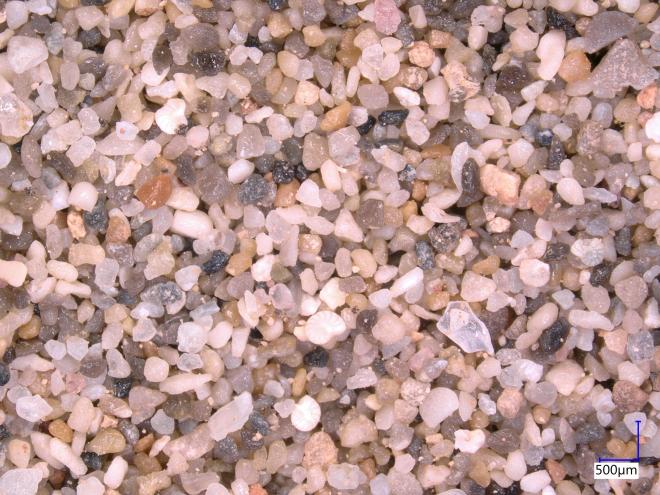
This “singing sand”, is due to localized shear: as you step into the sand, it causes the grains to rub past one another and generate sound [Humphries, 1966]. This tends to happen if the sand grains are well-sorted (all more or less the same size) and highly spherical [Lindsay et al., 1976]. In the photograph below, the sand grains don’t look particularly spherical, but they are indeed quite consistent in size (just compare with one of the more poorly-sorted samples we looked at in previous weeks).
Lindsay, J. F., Criswell, D. R., Criswell, T. L., & Criswell, B. S. (1976). Sound-producing dune and beach sands. Geological Society of America Bulletin, 87(3), 463-473.
Vriend, N. M., Hunt, M. L., Clayton, R. W., Brennen, C. E., Brantley, K. S., & Ruiz‐Angulo, A. (2007). Solving the mystery of booming sand dunes. Geophysical research letters, 34(16).
Last week, the Newfoundland (on the east coast of Canada) got hit by a record-breaking storm: a “hurricane blizzard”, with 150 km/h winds, >10 m waves, and almost a metre of snow. Newfoundlanders are no strangers to bad weather, but this is rough stuff even by their standards.
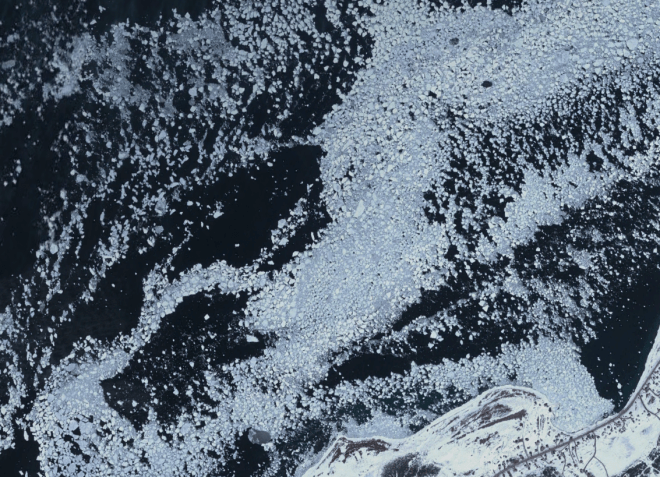
In a fit of procrastination, I started wandering around Newfoundland in Google Earth. The Strait of Belle Isle separates the northern tip of Newfoundland from the rest of Canada, and is often frozen over in the winter. When this ice breaks up in the spring, it makes beautiful patterns from space. What struck me was that the broken ice floes looked a lot like the microscopic sand photographs I have been posting on this website:
Ice floes in the Strait of Belle Isle, Newfoundland on April 22, 2015. For scale, the big floe on the left is 150 m across its longest axis.When you zoom out a bit further you can start to see larger patterns that appear to be formed by different flows shearing past one another. For scale, look at the 150 m-long floe in the middle (which we saw in the previous photo).
Apparently the shape and size of sea ice floes is largely governed by ice melting, collisions and mergers between floes, and breakup due to flexing by ocean swell waves (Toyota et al., 2006). Even though the specifics of the mechanisms moving and shaping sand grains on the seabed at millimetre scales are different from those acting on ice floes one million times larger, the same general laws of physics still apply. This is one of my favourite things about nature: there is great beauty in finding similar patterns at different scales in completely different contexts!
A few weeks ago, I shared some sand that my dad brought back from the Butt of Lewis. On that same trip, he and my mom went to visit the island of Barra, where her family originated from before emigrating to eastern Canada in the 1770s.
Halfway through their holiday, I received an excited text message from my dad: “Tell me – the whole island seems like grey granite, so where does the white sand come from? (In fact all the west side beaches are white sand.) Is it coral?”
Eager for a distraction from my work, I did a quick lit review. The consensus seems that indeed, the white sand on the beaches has almost nothing to do with the gneiss found on the rest of the island. In essence, it seems as though most of the original sand was bulldozed there by glaciers during the last ice age or brought there by meltwater as they retreated. Then over the course of the past few thousand years, shell fragments have accumulated and overwhelmed the native glacial sand, making up 7.5% to 82.9% of the total sand. This results in the beautiful white beaches that you see today (Jehu & Craig, 1924; Goodenough & Merritt, 2007).
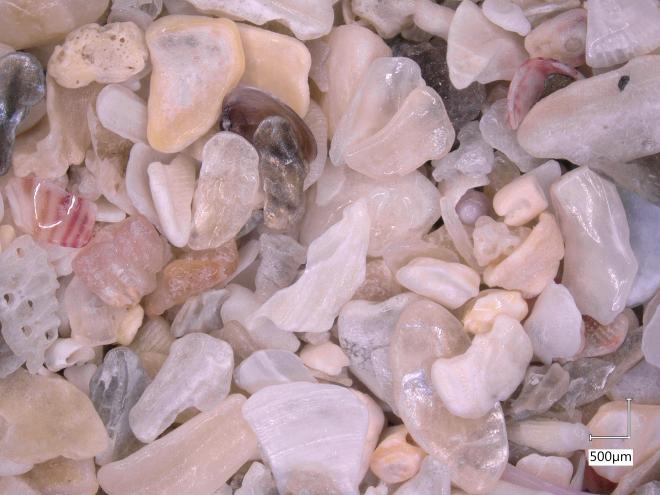
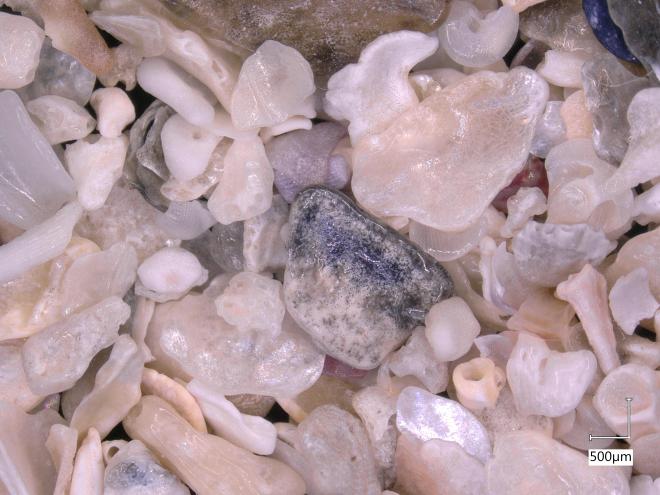
This might be my favourite sample of sand that I have analyzed yet- it is incredibly shelly, and every photo reveals beautiful new shapes and patterns. I think I will just let the sand speak for itself:
When you zoom out, it doesn’t look like much……but zooming in reveals all sorts of interesting shell fragments with different structures and colours.
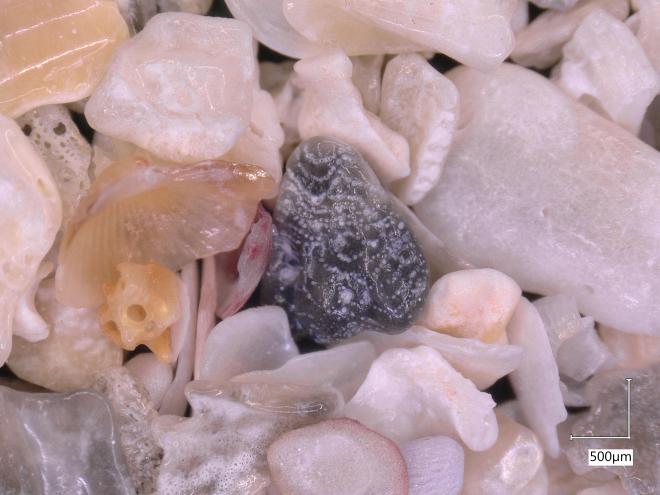
I particularly love the piece in the middle of this photo: it almost looks like a piece of glazed pottery.
I’m really quite curious as to what the red and white fragment in the upper left quadrant is. It looks like a piece of octopus tentacle, although I know it can’t be!Purple is my favourite colour, so I love the shade of the fragment in the lower left corner. It actually looks a lot like the coralline algae we saw in my photographs of sand from Archipel Glenans. I wonder if something similar is present offshore of Barra… The cylindrical fragment on the right side makes me think of a Roman column.
This one might be favourite- I zoomed in to 40x magnification to take a closer look. The patterns of the white bubbles are beautiful- I am very curious whether that is a shell fragment or actually some sort of igneous rock left over from Scotland’s volcanic days…
I love the iridescence of the shell at mid-right, and the vivid pink streak in the top left quadrant. So many cool shapes and colours!
I hope you enjoyed those as much as I did. I just wish I knew more about ecology so that I had a better idea of what we were actually seeing here!
When I started this blog, I wanted to focus mainly on things related to coastal science and engineering, but for a moment I’d like to post something more personal. A few of my close friends and colleagues have had a tough week, but has also been an eventful one on the world stage.
The violence and political turmoil following the killing of Qassem Suleimani last week has been awful and frightening, but on Wednesday things took an unexpected turn for the worse. A civilian airplane carrying 176 people crashed, apparently shot down not long after it took off. It later emerged that 63 of those passengers were Canadian, and the majority of those on board were en route to Canada.
It wouldn’t matter where they were from or where they were going, it would still be an immense tragedy and terrible waste of human lives. But this one really hit me hard because as I read through the stories of all the victims, I was struck by a simple fact: a significant proportion of the 63 were science and engineering grad students or recent graduates, just like me. They were all just coming back to school after visiting their families for the holidays, just like I did last week. Just like most of my friends here.
One of my closest friends from home is an Iranian-Canadian engineer, and many of my TAs at the University of Waterloo were Iranian. I can’t help but think of them, and of all my friends and colleagues when I read about the people who were on that plane. Bright people with lives and stories, minding their own business, just going back to school or work.
2020 is not off to the greatest start so far, but we have to hope it can get better, and we have to do our best to make it so, even in our own small way. As my mom says, “never give up a chance to be kind”. Let’s start with that.
I recently paid a visit to my grandmother in Glasgow, Scotland. She is 94 1/2 years old and is still a delight to be with. Since she is living in a retirement home now and doesn’t get out much these days, I rented a car and we went for a drive together down the coast to Troon:
On our way back to Glasgow I pulled over the car in Ardrossan and grabbed a handful of sand from the beach there:
Sand from the beach at Ardrossan, Scotland. It appears to be fine, well-rounded quartz sand. Note the beautiful red tint of the grains.
When I showed my dad this photo, he pointed out that the pink sand grains resembled the red sandstones found in houses and buildings all across Glasgow, the city where he grew up. When I looked into it further, it seems that many of the sandstone bricks used in facades across the city indeed came from Ayrshire, where this beach was located. This is backed up by a geological map of the Firth of Clyde, which shows our little beach comfortably inside the red sandstone zone. A delightful convergence of sediment and architecture!
The Kelvingrove Gallery, one of my favourite places in Glasgow. If you ever find yourself in Glasgow I highly recommend it- it’s free! Note the beautiful red sandstone facade.
That’s one of my favourite things about this field- there always seems to be new and interesting connections back to other things that I love!
Majestic highland cows in Pollock County Park, Glasgow. Note their beautiful red sandstone facades.
This week our sand comes from the delightfully-named Butt of Lewis, the northernmost point of the Isle of Lewis. Lewis is part of the Outer Hebrides, an archipelago off the west coast of Scotland. My parents visited there this summer as part of a trip to Barra, a neighbouring island and the ancestral home of my mom’s family. My dad brought back a little bag of sand from the beach at Ness:
The most important question here is obviously not about the sand though, but rather, why they called this place the “Butt of Lewis”. After half an hour of creative and persistent googling, I couldn’t find anything, though. My guess is just that it’s because it’s at the very back end of the island. But also quite windy?
Live, from the windy Butt of Lewis… [Source: BBC Weather]
This week, we have sand from the beach at Le Vourc’h near Porspoder in Brittany, France. I just returned from a two-month research visit to IFREMER in Brest, and while I was out there I was fortunate enough to rent a car and tour the countryside.
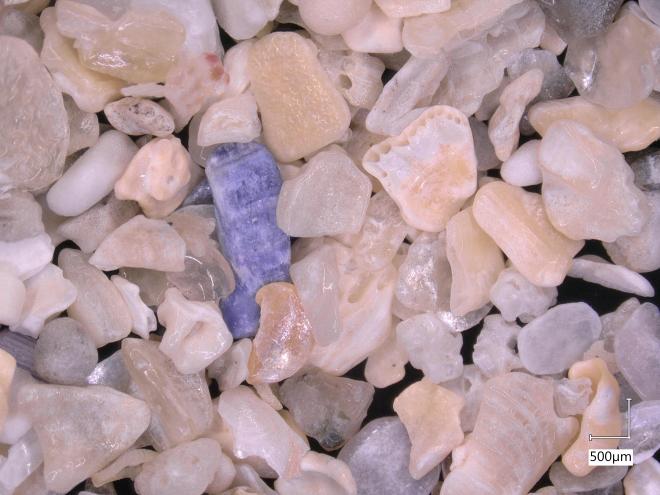
The beach appears to be mostly white quartz sand, but this sample had a single mysterious black grain, sticking out of the picture like the monolith in 2001: A Space Odyssey.
Sand from Porspoder Beach in Brittany, France
When I visited in November, the rocks surrounding this beach were being absolutely pulverized by massive waves, and this was only during a “minor” storm.
Nothing like watching >4 m waves smash against rocks for half an hour to remind yourself that you are a puny human who is lucky to be alive in the face of natural forces that care not one iota about our well being.
My friend Claudia responded with great zeal to my call for sand from different beaches around the world. In addition to her samples from Sword Beach and Dunkirk, she also brought back sand from her holiday to the Greek island of Crete. The sand from Xerokambos Beach is interesting compared to those two French beaches, since it is much more diverse- there are many different colours and likely different mineral origins for the sand grains that we see there.
That being said, when I see pictures of how lovely Crete looks, I have the feeling that I would not be too focused on the finer details of local sand composition if I went on holiday there!