Mangrove forests provide valuable coastal habitats but also provide a natural form of coastal flood protection and a host of other services. However, many of these mangrove forests are threatened by coastal development and groundwater pumping-induced subsidence, among other natural and human changes. Part of the challenge is that mangroves are extremely choosy about their habitat, and need just the right combination of tidal submergence and mud to take root. If these habitats are thrown out of balance by people or natural causes, it becomes hard for new mangrove seedlings to grow there and sustain the forest.
To make happier places for the mangroves to develop, different kinds of coastal fences/dams have been proposed. The general principle is that waves and currents are attenuated or blocked by the fences, which makes a nice quiet area behind them for mud to accumulate and mangrove propagules to take root. What impact do these structures have on the coastal “conveyor belt” transporting mud and propagules? Enter Nirubha Raghavi Thillaigovindarasu!
Just before Christmas, Raghavi successfully defended her thesis, “Mangrove-Sediment Connectivity in the Presence of Structures Used to Aid Restoration“. Beginning with a numerical model of a site in Indonesia to simulate the motion of rivers and tides, she then applied the SedTRAILS model to visualize and interpret the pathways of sediment and mangrove propagules as they journeyed along the coast. By adding structures to her model, she was able to demonstrate how this trapping behaviour has an influence in the vicinity of a structure but also up to a kilometer away.
Do you ever think about the swirling patterns in your cappuccino as you stir your spoon around, the brown coffee folding in past the white foam? And do you ever think about sediment transport as you do it? Just me? Ok, never mind…
I had the great privilege of hanging out in New Orleans this past week, being a sand nerd with four hundred of my fellow sand nerds at the Coastal Sediments conference. In between jazz sets at the Spotted Cat, we shared our latest ideas about coastal dynamics, built new collaborations, and rekindled old pre-pandemic friendships. My contribution this year was an attempt to bring the science behind cappuccino coffee swirls to coastal sediment transport.
What is the fate of nourished sand? What are the pathways of sediment on an ebb-tidal delta or in a tidal basin? What role does sediment play in the UNESCO-world heritage area of the Wadden Sea? We are looking for a curious and motivated postdoc to work with us on an exciting project here at TU Delft in the Netherlands. The main goal of this position is to develop and test novel simulation approaches to trace pathways of different sediment types, and to predict sediment dispersal and morphodynamic responses to different nourishment strategies.
I also worked on this project as a postdoc until recently starting a new position, and I really enjoyed both the topic and teammates. Now you have the opportunity to join our team and continue developing this research! A summary of previous work on the project can be found here: https://coastallycurious.com/2022/12/15/tracking-sand-that-hides-from-the-sun/
Come join our TRAILS team! Feel free to get in touch with us if you have any questions. Applications close March 12th, 2023!
Mangrove forests protect tropical coastlines around the world from the effects of waves, in addition to providing valuable habitat for countless species. As such, their preservation and restoration is a key element of many plans for improving coastal resilience against flooding and erosion in the face of climate change. However, you can’t *just plant* a mangrove forest anywhere – mangroves are extremely picky, dancing on the edge of the intertidal zone where they get just wet enough but never too wet for too long. They also need safe, stable shorelines for their seedlings to take root and grow stronger, without too many waves and with just the right sort of muddy conditions to make a comfortable home.
Mangroves drop their seeds (called propagules) in the water, which then float around with the currents for days to weeks until they find a suitable home. But which pathways do these mangrove seedlings take as they float along the coast? Are those the same pathways that sand and mud take? These are questions that we need to answer in order to make better decisions about mangrove restoration. To get to the bottom of this, we recruited Femke Bisschop.
Keeping Dutch feet dry is mainly done by placing piles of sand along the coast as “nourishments”. These nourishments build out the beaches and dunes to act as a protective buffer against storms. However, as was recently pointed out by an official at Rijkswaterstaat, the Dutch water ministry, the Hamvraag or “bacon question” is still “where the heck does all that sand actually go?”
Knowing where nourished sand goes is important for understanding the ecological impact of nourishments, as well as their effectiveness. If you want your sand to reach a certain destination, how much of it actually gets there and how quickly?
In the past few weeks, Vancouver and the BC Lower Mainland have suffered not just one but three record-breaking rainstorms, a succession of ”atmospheric rivers” that dumped several hundred millimetres of rain. Highways washed out and disappeared, and numerous communities were flooded. This resulted in an enormous quantity of sediment reaching the sea via the Fraser and other local rivers. But where exactly does the sediment that’s already in the sea around Vancouver go? How has that changed in the past few hundred years since Europeans colonized the area? To get to the bottom of this, we enlisted Carlijn Meijers.
Last week, Carlijn successfully defended her thesis, ”Sediment transport pathways in Burrard Inlet”. To answer these questions, she created a detailed hydrodynamic and sediment transport model of Burrard Inlet and Georgia Strait in D-Flow FM. She then used the SedTRAILS model that we have developed to visualize sediment transport pathways.
Modelled sediment transport pathways in Burrard Inlet. The red arrows highlight key patterns in the SedTRAILS particle trajectories. Burrard inlet is characterized by strong flows through the narrowest points of the fjord, and large eddies in the wider areas. Source: Meijers (2021).
From these models, Carlijn showed that sediment transport is largely controlled by flow through the First and Second Narrows (where the Lion’s Gate and Ironworker’s Memorial bridges cross). As the tide comes in, the water shoots through these narrow passages at speeds of up to 2 m/s and comes out the far side as a jet, spiraling off into eddies. The tide then goes out and the same happens in reverse, with water shooting out the opposite side.
Conceptual diagram showing the dominant sediment pathways in the Inner Harbour. Source: Meijers (2021).
Due to the sheltered nature of the inlet, waves have only a minor role in sediment transport. However, given the intensity of the tides and the great depths of Burrard Inlet (especially the Indian Arm fjord to the north), most sediment liberated by erosion tends to get carried away from shore and is essentially lost from the coastal sediment budget.
Another key point of her project was to investigate how land use changes and other human effects (e.g., damming rivers, port construction) have changed Burrard Inlet. Using the model, Carlijn showed that these changes to the inlet have shrunken its tidal prism, influencing the currents and sediment transport patterns.
Comparison of the present-day shoreline with the high and low tide lines from 1792, prior to colonization by European settlers. The Second Narrows are so narrow because they were formed by the delta of Seymour River and Lynn Creek. The area has since been dredged and walled off for the construction of the port and to create log booming grounds. Source: Meijers (2021).
These changes are especially evident when we compare satellite photos from the present day with the oldest available images from the 1940s.
Second Narrows in the 1940s and 2021. Please forgive my crappy georeferencing, I eyeballed it. Source: City of Vancouver and Google Earth.
Carlijn wrote an excellent report and capped it all off with one of the best master’s thesis defenses that I’ve seen in a long while. She also handled the cultural context of the project with great respect, interest, and sensitivity. If anyone reading this is looking to recruit a new engineer/researcher with heaps of potential, I cannot recommend Carlijn enough.
All in all, this was a fascinating project and one very close to my heart — I was born in the Vancouver area and was excited to see how the SedTRAILS model could be used in my original backyard. Let’s keep the Delft-Vancouvercollaborations going!
Ebb-tidal deltas are gigantic piles of sand that form at the seaward mouth of tidal inlets. They are constantly on the move, shifting shape and size in response to the waves and tides. Where exactly is that sand going? This is a question I have been struggling with for the past 5 years during my PhD, and we have recently made great strides in part due to the efforts of Paula Lambregts.
Yesterday, Paula Lambregts successfully defended her master’s thesis, “Sediment bypassing at Ameland inlet“. I had the great honour of co-supervising Paula’s research throughout the last ten or so months, and I am enormously proud of her. Her project encompassed a range of approaches, including bathymetric analysis and numerical modelling, to solve the mystery of the sediment pathways.
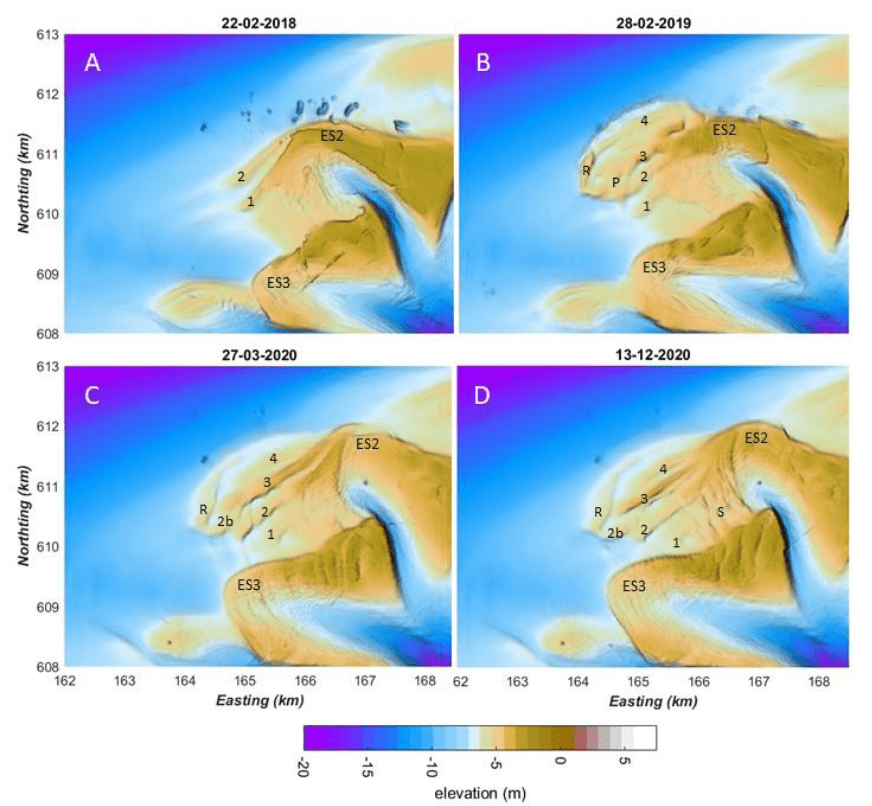
First, Paula’s detective work led her to examine detailed measurements of the seabed bathymetry at Ameland Inlet in the Netherlands, taken over the past fifteen years. These measurements give snapshots of the underwater delta landscape. By comparing the bathymetry from different months or years, we can track the delta’s evolution. In the image below, we see four snapshots of the ebb-tidal delta before and after the construction of a sand nourishment (i.e., the large pile of sand that appears in panel B). This nourishment was a large-scale pilot test to determine if creating sand deposits like this is a viable strategy for strengthening the coast of nearby islands.
Bathymetric maps showing Ameland Ebb-Tidal Delta before (A) and after (B,C,D) the construction of a massive sand nourishment. Paula’s analysis tracked how this nourishment evolved over time, smoothed and smeared out to the east and south east by the combined effects of waves and tides.
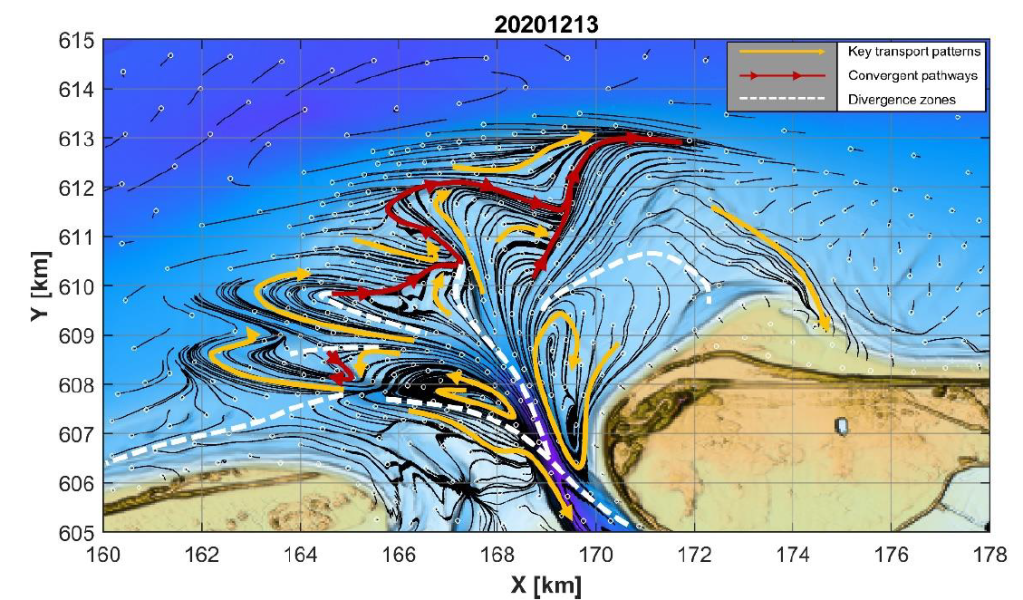
After describing how the delta has evolved in the past, Paula developed hypotheses about the physics underlying this behaviour- how do waves and tides move the sand around to create the patterns we observe? To answer this question, she used a combination of computer models to estimate sand transport pathways. This allows us to “connect the dots” and explain how the sand moved from one place to another. The first component was a D-Flow FM model, which is used to simulate the hydrodynamics (waves and tides) and sediment transport (where and how much sand moves). The second component of her modelling approach was to apply SedTRAILS, a brand-new tool developed by my colleagues and I at Deltares for visualizing predicting sediment transport pathways. Using SedTRAILS, she was able to create some really cool maps that indicate where the sand goes.
Sediment transport pathways on Ameland ebb-tidal delta in 2020, as visualized using SedTRAILS. The small white circles indicate the source locations of sediment, and thin black lines show the sediment pathways originating from those sources. The yellow lines highlight major transport pathways, and the red lines indicate convergent zones where multiple pathways meet. The white dashed lines indicate divergence zones, where the transport pathways veer away from and (on average) do not cross.
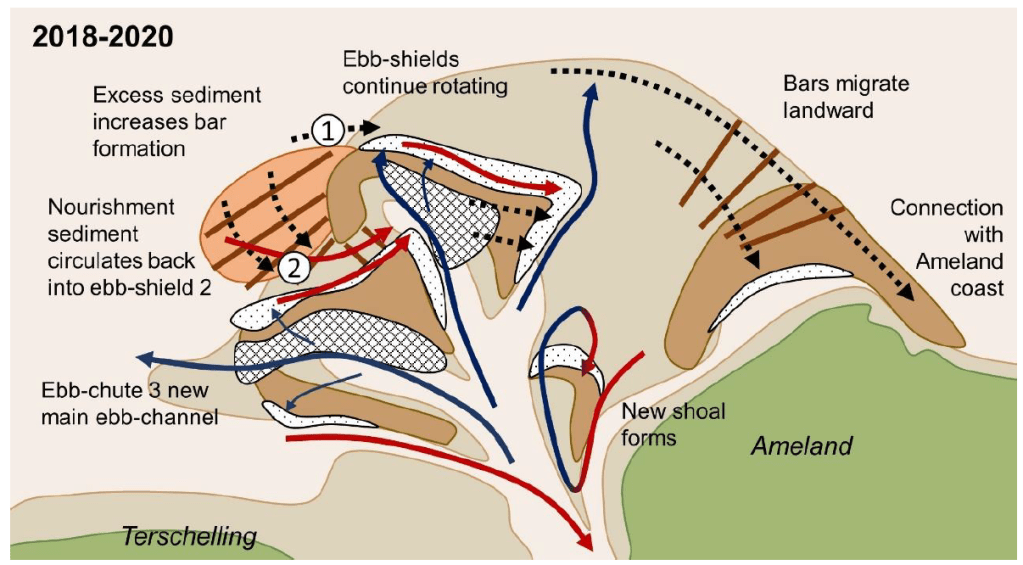
Drawing on her prior expertise in geology, Paula combined those two lines of evidence (the measurements of the seabed and the modelled sediment pathways), to come up with a series of fantastic conceptual diagrams. These diagrams distill the mysterious piles of sand and complex spaghetti of the images above into a more easily understandable picture:
Paula’s conceptual model summarizing all of the different processes shaping Ameland ebb-tidal delta in 2020. Check out her thesis to see the complete evolution over the past 15 years!
The work that she did is extremely valuable for coastal management, since it gives more insight into where (and where not!) to construct sand nourishments. It also brings new insights to science about how these complex systems work. Last of all, it is enormously helpful for the research that we are continuing to do at TU Delft and Deltares. In September I will continue on with the work on sediment transport pathways at tidal inlets begun during my PhD, and build on the work that Paula has carried out in her thesis project. I am extremely proud of her and hope that we can continue to collaborate in the future!
It has been a crazy year, but work-wise I am on the final stretch, at least. Tonight at the ungodly hour of 12am CET, I will present my poster at the American Geophysical Union conference. It is at a much more reasonable 3pm PST in California where the conference organizers are located. If you have registered for the conference, you can see the poster via this link. Otherwise, I will try to put you in the loop here.
Estuaries are complex environments shaped by the interaction of waves, tides, rivers, and humans. Understanding how sand and mud move through estuaries is essential for their effective management. In an approach known as connectivity, the pathways taken by sand and mud through estuaries can be represented as a connected network of nodes and links, similarly to a subway map. Connectivity provides numerous mathematical techniques and metrics that are well-suited to describing and comparing these pathways in estuaries.
Network diagrams depict the sediment transport pathways of each estuary as a series of nodes and connecting links. The Mouth of the Columbia River (1) and San Francisco Bay (2) are on the west coast of the United States, while Ameland Inlet (3) and the Western Scheldt (4) are in the Netherlands. Red arrows indicate the 90th percentile of all connections in terms of sediment fluxes, superimposed on greyscale bathymetry of each estuary.
We use connectivity to map out and analyze sand and mud pathways in four estuaries around the world: the Wadden Sea (the Netherlands), Western Scheldt (NL), San Francisco Bay (US), and Columbia River (US). Our analysis is based on the outcome of numerical simulations, and we explore the benefits of different simulation techniques. We conclude that connectivity is a useful approach for visualizing and comparing the pathways that sand and mud takes through different estuaries. We can use this method to plan and predict the impact of human interventions in these environments, such as dredging.
However, a comparison of connectivity metrics suggests a dependency not just on sediment transport processes, but also on the choices made in schematizing networks from underlying models. Essentially, we’re not comparing apples to apples yet, so if we are going to make comparisons between different estuaries, we need to make sure that we set up our models in an equivalent way. Our ongoing research will focus on optimizing these numerical models to make more meaningful quantitative comparisons of different estuaries.


