

After 5 years of blood, sweat, and tears, I present to you my PhD thesis: Sediment Pathways on Ebb-Tidal Deltas: New Tools and Techniques for Analysis! I will defend my PhD on March 8th.
How do sand and mud move around on our coasts? This is a question that we need to answer in order to sustainably manage coastlines in the face of sea level rise and climate change. To do so, we use a combination of field measurements and computer simulations at Ameland Inlet in the Netherlands. In the course of my PhD we developed several new methods, including morphodynamic mapping techniques, a sediment composition index (SCI) derived from optical and acoustic measurements, techniques for sediment tracing, the sediment connectivity framework, and a Lagrangian sediment transport model (SedTRAILS). Together, these approaches reveal new knowledge about our coasts which can be used for managing these complex natural systems.
That’s a bit of a mouthful, so let’s break it down and try to explain what I have been doing with sand for the last half-decade…
The Netherlands has beautiful beaches and dunes, which actually protect the country from flooding. To keep everyone safe, they place lots of sand along the coast to build these natural defenses. However, the coast of the Wadden Islands is a lot more complicated, and we need to figure out how sand moves around there if we are going to protect it. Where does all the sand go? We don’t even have the right tools to answer this question yet, so we will need to try some new approaches.

What is an ebb-tidal delta and why do we care how sand and mud move around there? It is a big pile of sand typically found in front of the gap between islands on sandy coasts, and influences everything from coastal erosion to navigational safety to ecosystems.

In order to figure out how the coast will evolve in the future, we need to learn more about what it did in the past and what it is doing today. We started by looking at lots of old maps. We then went with a huge team to Ameland Inlet and ebb-tidal delta to take measurements of the waves, tides, sand, mud, and more. Let’s see what we can do with all this information!

After spending all that time looking at old maps, we figured there must be a more effective way of analyzing so much data. We came up with some new techniques for combining all the old maps into a single diagram that makes it easier to see how the sand is moving around. We also used those maps to construct a picture showing how all the different layers of sand have piled up or eroded over the years. This is useful for figuring out where to put sand to protect the coast, but also handy for geologists and other people trying to understand ancient rocks made in the same kind of environment.

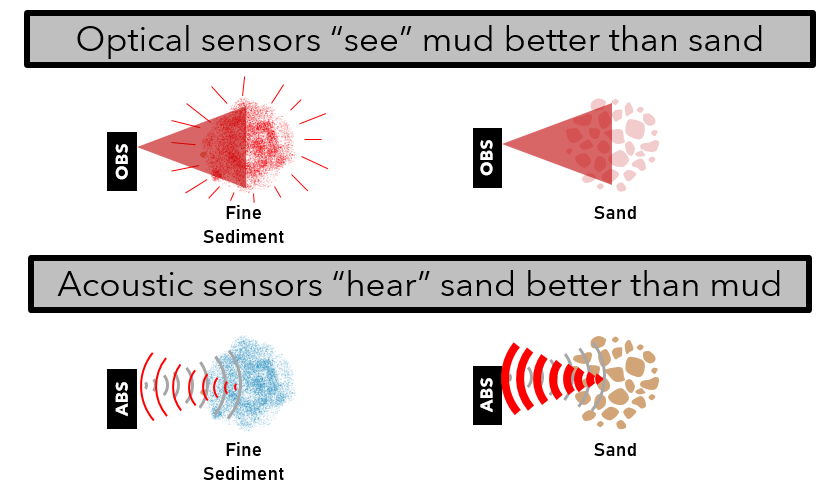
The next thing that we did was to see how big the sand particles floating through the water in Ameland were. This is important information for understanding where, how much, and what size of sand is moving around out there. Hopefully we can link the wave and tidal conditions with what we observe floating around in the water. However, this goal was made a lot more complicated by the fact that there is a lot of mud floating around in the waters of Ameland! The mud forms clumps about the same size as the sand grains, making them hard to tell apart using only one tool. We decided to try tools that use sound and light to measure the sand and mud. We can “hear” the sand better than mud and “see” the mud better than sand, which helps us tell them apart. I went to Ifremer in France to do some laboratory tests and try out our theory. When we applied it to our Ameland data it worked pretty well!
To figure out how the natural sand in Ameland moves around, we put some fluorescent green magnetic sand on the bottom of the ocean, then let the waves and tides move it around. We then went back in a boat every few days to look for it and see if we could find any. Everyone told us that we would never see our green sand again, but we found lots! We used magnets and scooped sand off the seabed then looked at it under a microscope in the lab. This taught us how the movement of sand grains depends on their sizes, and we got some ideas about how this approach could be used to monitor sand nourishments in the future.
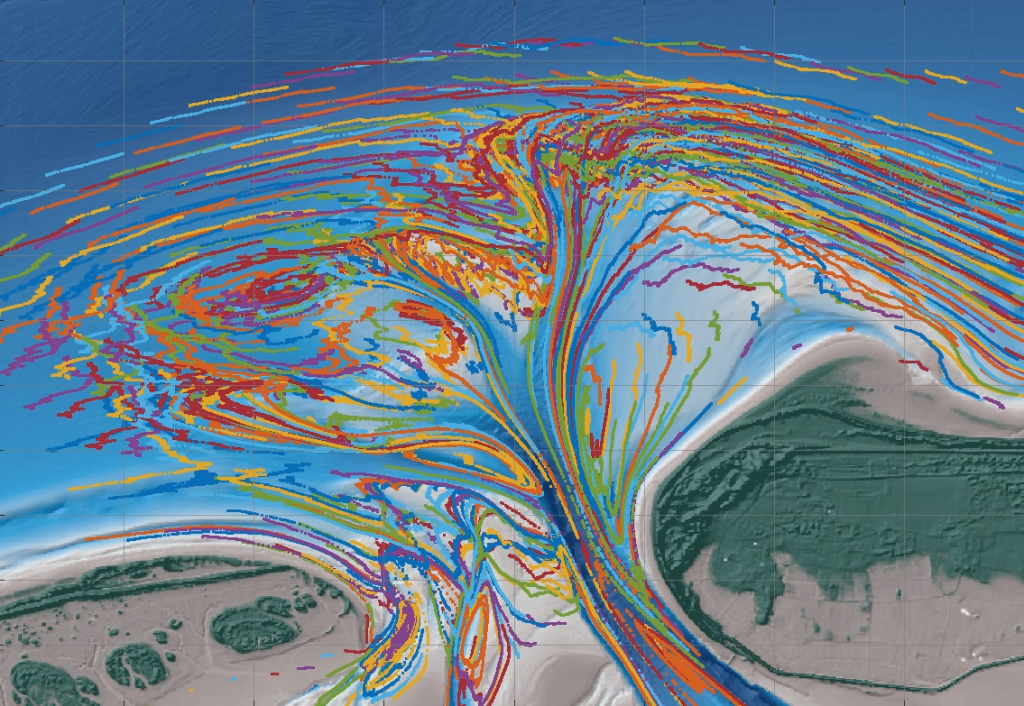
We have been thinking a lot about the pathways that sand and mud take along our coasts, and it often seems far too complicated- it is like a big plate of spaghetti with noodles going all over the place. To keep track of everything, we borrowed a nifty approach from other fields like marine ecology and neurology to describe sand pathways as a series of nodes and links, sort of like in a subway map. This makes it much easier to describe and count the paths. With this approach, we can begin to untangle the spaghetti!

We are pretty excited about sediment connectivity, but want to use this method faster and in greater detail. To do this, we developed a model (SedTRAILS) that lets us follow sediment particles around, sort of like we did earlier with the green sand. I was lucky to visit the USGS in California to spend some time working on it. SedTRAILS greatly expands the way we can visualize and interpret sediment pathways, and we have a lot of ideas about how we can make it even better in the future. I will spend the next three years as a postdoc at TU Delft and researcher at Deltares to continue developing SedTRAILS, and I am so excited!
How to summarize five years of research in just a few words? We didn’t have the right tools to answer our questions, so we had to develop them: new mapping techniques, an approach for “hearing” sand and “seeing” mud, techniques to follow individual grains of sand around, a new way of thinking about sediment pathways, and a computer model for predicting those paths. These helped us learn a lot about ebb-tidal deltas and how sand moves around on them, and provide useful tools and knowledge for managing our coasts.

Excellent summary Stuart – one that even I can understand!
LikeLike
Thanks a lot Stuart, very informative.
LikeLike