Ebb-tidal deltas are notoriously unpredictable. Battered about by waves and tides, their ever-shifting sands can be a royal pain in the arse for everyone from coastal residents to pirates. I have spent most of the past five years trying to identify the pathways that sand takes across these deltas as part of my PhD. However, the holy grail of ebb-tidal delta research is to take that one step further and make accurate morphodynamic predictions of their evolution on timescales of decades.
This past year, Denzel Harlequin took up the challenge, and I am pleased as punch to announce that last week he successfully defended his master’s thesis, ”Morphodynamic Modelling of the Ameland Ebb-Tidal Delta”. This is a really tricky problem to solve because of the complexity of the processes that need to be simulated.
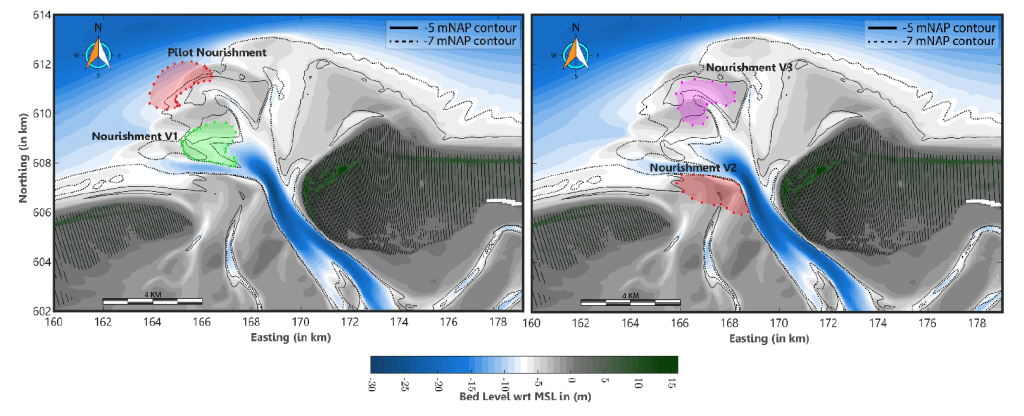
What’s cool about Denzel’s work is that brings us closer to good morphodynamic predictions than we were before. Furthermore, where the predictions deviate from reality, he illuminates the areas where we still need to make improvements — specifically, our representation of wave-driven transports. Denzel also shows how the location of a sand nourishment can have major knock-on effects on the evolution of the ebb-tidal delta.
Different nourishment designs tested by Denzel. If you place the sand in a more dynamic area like a channel, it can have a much wider effect on the rest of the ebb-tidal delta.
Denzel is a very talented modeller and I am delighted that he has joined us as a new colleague in the Applied Morphodynamics department at Deltares. I look forward to many more great collaborations to come!
We forgave Bagnold everything for the way he wrote about dunes. “The grooves and the corrugated sand resemble the hollow of the roof of a dog’s mouth.” That was the real Bagnold, a man who would put his inquiring hand into the jaws of a dog. – Michael Ondaatje, The English Patient
Ralph Bagnold, widely considered one of the godfathers of sediment transport, was a soldier in the British army who spent much of the Second World War scouting around in the Libyan desert. In the process, he learned much about the dynamics of sand dunes, and formed the basis for many theories that are still in use today for explaining how sediment is blown around by wind or water.
This week I am proud of our very own up-and-coming Bagnold, Charlotte Uphues, who successfully defended her thesis, Coastal Aeolian Sediment Transport in an Active Bed Surface Layer, on Thursday. Charlotte did a fantastic job of designing and carrying out her own super cool field experiments, using tracer sediment to estimate aeolian (wind-blown) sediment transport on a beach here in Holland. As the dunes of the Netherlands are a key component to Dutch coastal defenses against flooding, it is essential that we understand better how they evolve by improving our abilities to predict aeolian transport.
I would elaborate a bit more about her findings, but Charlotte will be submitting her thesis for publication in a journal soon, so it will remain under wraps for now. Stay tuned, I don’t think we’ve heard the last from Charlotte!
Ebb-tidal deltas are gigantic piles of sand that form at the seaward mouth of tidal inlets. They are constantly on the move, shifting shape and size in response to the waves and tides. Where exactly is that sand going? This is a question I have been struggling with for the past 5 years during my PhD, and we have recently made great strides in part due to the efforts of Paula Lambregts.
Yesterday, Paula Lambregts successfully defended her master’s thesis, “Sediment bypassing at Ameland inlet“. I had the great honour of co-supervising Paula’s research throughout the last ten or so months, and I am enormously proud of her. Her project encompassed a range of approaches, including bathymetric analysis and numerical modelling, to solve the mystery of the sediment pathways.
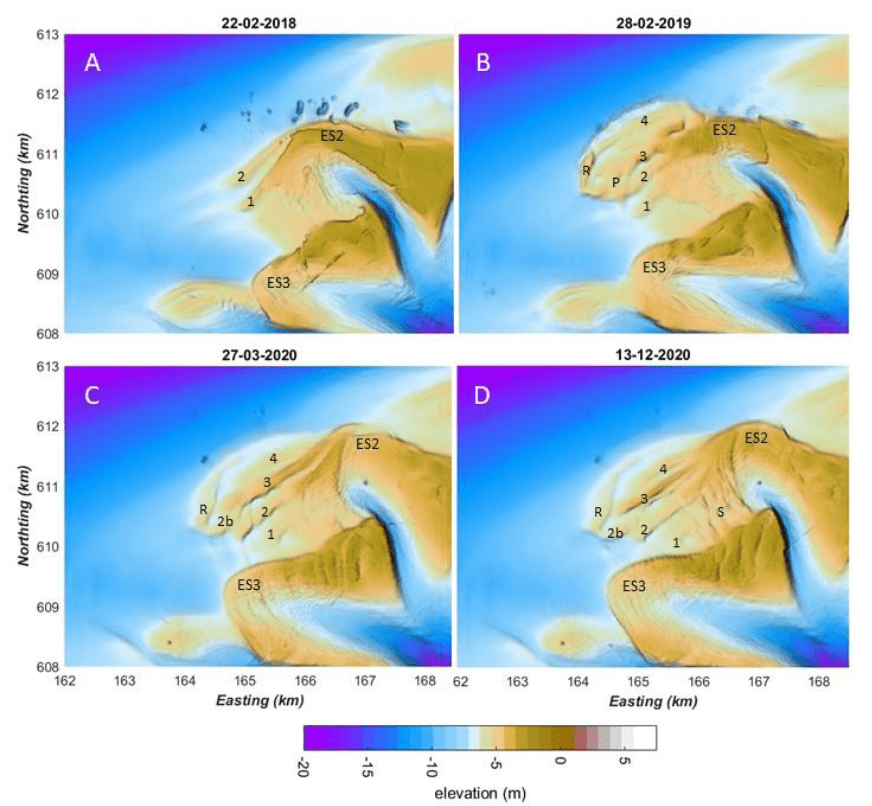
First, Paula’s detective work led her to examine detailed measurements of the seabed bathymetry at Ameland Inlet in the Netherlands, taken over the past fifteen years. These measurements give snapshots of the underwater delta landscape. By comparing the bathymetry from different months or years, we can track the delta’s evolution. In the image below, we see four snapshots of the ebb-tidal delta before and after the construction of a sand nourishment (i.e., the large pile of sand that appears in panel B). This nourishment was a large-scale pilot test to determine if creating sand deposits like this is a viable strategy for strengthening the coast of nearby islands.
Bathymetric maps showing Ameland Ebb-Tidal Delta before (A) and after (B,C,D) the construction of a massive sand nourishment. Paula’s analysis tracked how this nourishment evolved over time, smoothed and smeared out to the east and south east by the combined effects of waves and tides.
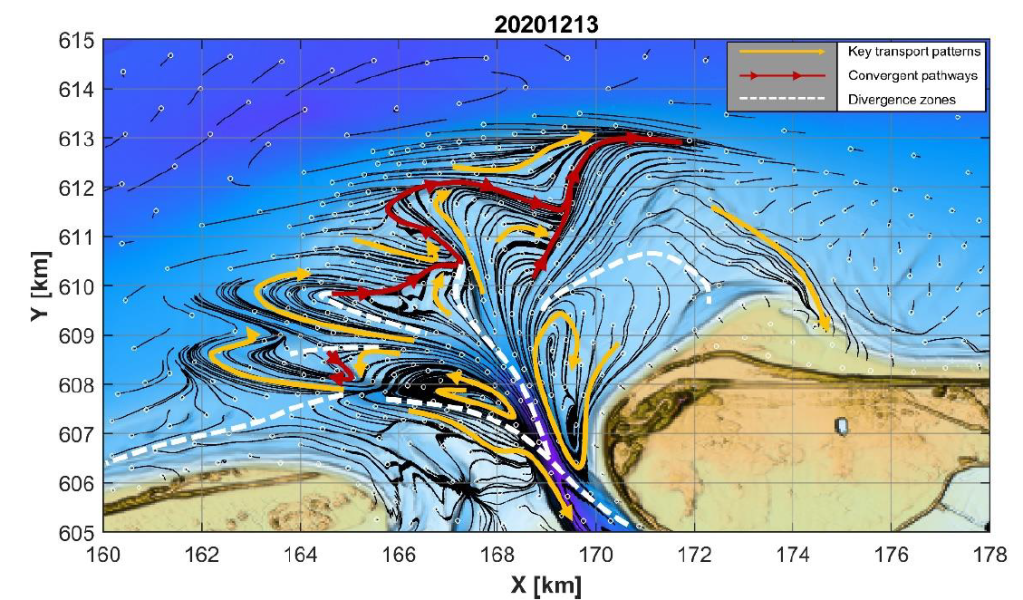
After describing how the delta has evolved in the past, Paula developed hypotheses about the physics underlying this behaviour- how do waves and tides move the sand around to create the patterns we observe? To answer this question, she used a combination of computer models to estimate sand transport pathways. This allows us to “connect the dots” and explain how the sand moved from one place to another. The first component was a D-Flow FM model, which is used to simulate the hydrodynamics (waves and tides) and sediment transport (where and how much sand moves). The second component of her modelling approach was to apply SedTRAILS, a brand-new tool developed by my colleagues and I at Deltares for visualizing predicting sediment transport pathways. Using SedTRAILS, she was able to create some really cool maps that indicate where the sand goes.
Sediment transport pathways on Ameland ebb-tidal delta in 2020, as visualized using SedTRAILS. The small white circles indicate the source locations of sediment, and thin black lines show the sediment pathways originating from those sources. The yellow lines highlight major transport pathways, and the red lines indicate convergent zones where multiple pathways meet. The white dashed lines indicate divergence zones, where the transport pathways veer away from and (on average) do not cross.
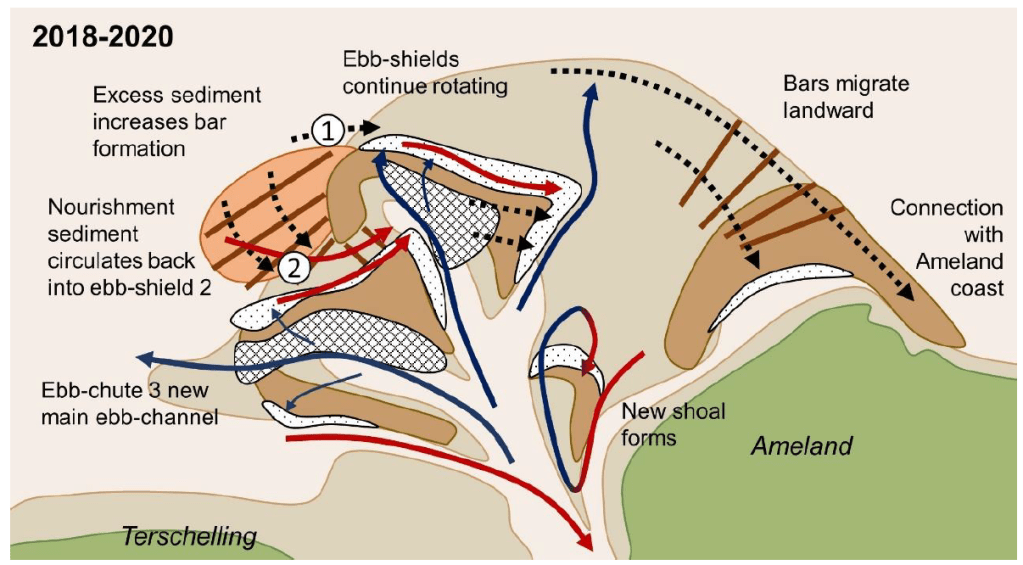
Drawing on her prior expertise in geology, Paula combined those two lines of evidence (the measurements of the seabed and the modelled sediment pathways), to come up with a series of fantastic conceptual diagrams. These diagrams distill the mysterious piles of sand and complex spaghetti of the images above into a more easily understandable picture:
Paula’s conceptual model summarizing all of the different processes shaping Ameland ebb-tidal delta in 2020. Check out her thesis to see the complete evolution over the past 15 years!
The work that she did is extremely valuable for coastal management, since it gives more insight into where (and where not!) to construct sand nourishments. It also brings new insights to science about how these complex systems work. Last of all, it is enormously helpful for the research that we are continuing to do at TU Delft and Deltares. In September I will continue on with the work on sediment transport pathways at tidal inlets begun during my PhD, and build on the work that Paula has carried out in her thesis project. I am extremely proud of her and hope that we can continue to collaborate in the future!
I love lighthouses, and am borderline obsessed with them. I have lucky lighthouse socks (I’m wearing them today), I own books about them, and in high school I made a papier-mâché lighthouse lamp. I have spent hours in the rain trying to photograph them during storms. Furthermore, they are most often found in places where the sea is at its most violent, and from a technical perspective, most interesting.
Naturally, when a bright master’s student from our lab asked if I was interested in joining his thesis committee to research the impact of breaking waves on lighthouses, I could not help but say yes. My research on coral reefs focuses mainly on the complex ways in which waves change as they break across the reef. In many ways, this is a similar process to what happens when waves hit the rocky shoals that many lighthouses are built on. This makes for a compelling intersection between my professional interests and private obsessions!
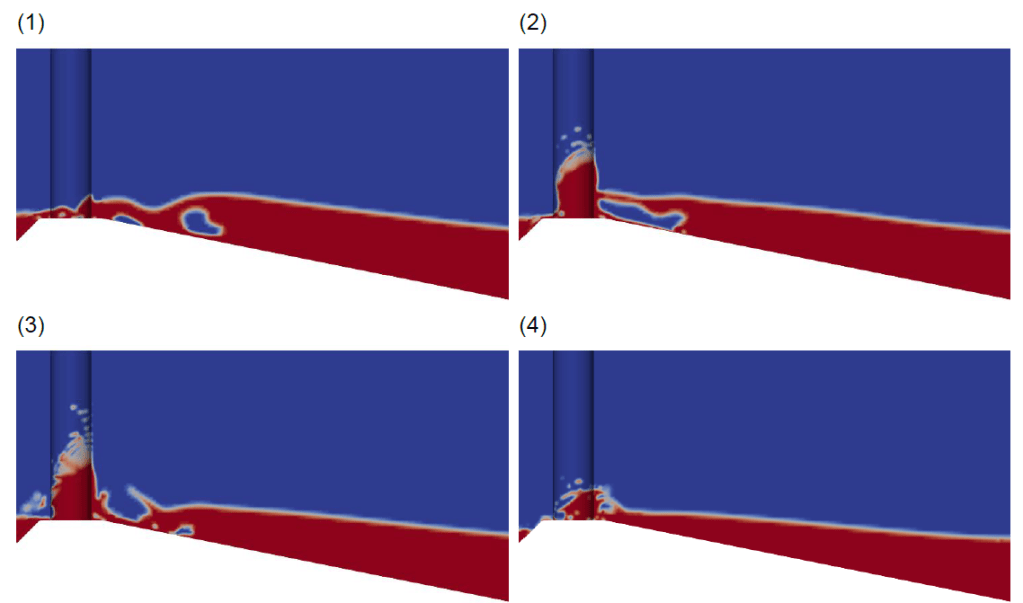
Simulation of a wave breaking on a rocky shoal and then colliding with a lighthouse, from Jan van Gorsel’s thesis. The blue represents air and the red water. It is really hard to predict something like this, because of the complex bouncing and splashing motion of the broken wave. Simulating this process is a bit like trying to predict the exact spatial distribution of spilled beer after a drunk guy stumbles and trips in a crowded pub. Sigh. Remember crowded pubs?Continue reading Lighthouse Fever
Coral reefs and the islands that they protect from flooding are in big trouble. This is arecurringthemeon thisblog, and now it’s time for the latest update. We are currently building towards the development of an early flood warning system for low-lying tropical islands fronted by coral reefs. Our previous work on this topic has focused on finding ways to do this accurately for a wide variety of coral reef shapes and sizes, as well as different wave and sea level conditions. However, it’s not enough to be accurate- to deliver timely early warnings, you also need to be fast.
That’s where the latest research of Vesna Bertoncelj comes in.
Vesna’s research provides us with new approaches for making highly accurate predictions of coastal flooding, at limited computational expense. The numerical models that we use to estimate flooding often take a long time to simulate, since they resolve many complex physical processes at high resolution in space and time. However, by paring down these models to only the most essential components for the task at hand, we can do this much faster. My colleagues at Deltares recently developed the SFINCS model, which has been successfully used to predict flooding in a fraction of the time that our standard models take. But how do we put all these different pieces together?
A schematic overview of Vesna’s research methodology. [Source].
First, Vesna established a baseline for model performance by running a computationally intensive XBeach Non-Hydrostatic model (XB-NH+), and a much faster SFINCS model. These models provide an estimate for runup (R2%), which can be taken as a proxy for coastal flooding. In the second step, she used a lookup table (LUT) of pre-computed XBeach model output and to derive the input for the SFINCS model. The crucial task is doing this quickly and accurately, so she experimented with different interpolation techniques for deriving that input. She then compared her new approach with the standard models to find the fastest and most accurate combination.
Her research gives us a useful methodology that we can implement to speed up our early flood warning system, saving time and hopefully someday saving lives.
Vesna’s quality of work is excellent and she has a fantastic attitude towards research and collaboration. Her curiosity, professionalism, and diligence will undoubtedly serve her well in the years to come. I hope that we will have other opportunities to collaborate in the future. If anybody out there needs a bright young coastal researcher and/or modeller, hire her!