Originally presented earlier today at the AGU 2021 Fall Meeting in the “Upgoer Five” Session, this video was inspired by the XKCD comic and book in which scientific concepts are described using only the 1000 most-common words in the English language. I participated in the session last year and had so much fun, I thought I would try it again with my coral reef research.
Unfortunately, ”ocean” and ”sea” were not on the list, so I had to go with ”big blue wet thing” instead. Want to give it a try yourself? Here is a handy tool which checks your writing to see if it meets the list of 1000 most common words: https://splasho.com/upgoer5/ It’s harder than it looks!
Here is a summary of my video:
Some small but beautiful lands in the middle of the big blue wet thing were built by tiny animals that turn into rock when they die. Although these lands might seem perfect and calm most of the time, they are actually in big trouble. The big water is going up and up and up, and the little lands could be completely under it before our kids grow old. However, they are also in trouble right now — waves can hit the little lands and make them go under the water too, even if just for a short while. These waves can hurt people and make the drinking water not-drink-able. It is hard to guess if the waves will cause trouble because they break in different ways than we are used to when they hit the rocks built by animals. The waves become longer and weirder as they move across the rocks, and can hit the land with more power than we would expect. It is even harder to guess what the waves will do because every small land made of rocks built by animals is different, and there are so many of them all around the world. To keep everyone safe, we showed a computer lots of made-up waves so that it could learn how waves look when they hit different sorts of rocks and land. The computer can then make good guesses about what real waves would do if they hit real rocks and land. If the computer thinks that the waves will cause trouble, we can warn people to go somewhere safer until the waves stop. In this way, we hope to keep everyone’s feet dry until long after our kids are old.
You can find more about this stuff in bigger words here:
1. Pearson, S.G., Storlazzi, C.D., van Dongeren, A.R., Tissier, M.F.S., & Reniers, A.J.H.M. (2017). A Bayesian‐based system to assess wave‐driven flooding hazards on coral reef‐lined coasts. Journal of Geophysical Research: Oceans, 122(12), 10099-10117. https://doi.org/10.1002/2017JC013204
In the past few weeks, Vancouver and the BC Lower Mainland have suffered not just one but three record-breaking rainstorms, a succession of ”atmospheric rivers” that dumped several hundred millimetres of rain. Highways washed out and disappeared, and numerous communities were flooded. This resulted in an enormous quantity of sediment reaching the sea via the Fraser and other local rivers. But where exactly does the sediment that’s already in the sea around Vancouver go? How has that changed in the past few hundred years since Europeans colonized the area? To get to the bottom of this, we enlisted Carlijn Meijers.
Last week, Carlijn successfully defended her thesis, ”Sediment transport pathways in Burrard Inlet”. To answer these questions, she created a detailed hydrodynamic and sediment transport model of Burrard Inlet and Georgia Strait in D-Flow FM. She then used the SedTRAILS model that we have developed to visualize sediment transport pathways.
Modelled sediment transport pathways in Burrard Inlet. The red arrows highlight key patterns in the SedTRAILS particle trajectories. Burrard inlet is characterized by strong flows through the narrowest points of the fjord, and large eddies in the wider areas. Source: Meijers (2021).
From these models, Carlijn showed that sediment transport is largely controlled by flow through the First and Second Narrows (where the Lion’s Gate and Ironworker’s Memorial bridges cross). As the tide comes in, the water shoots through these narrow passages at speeds of up to 2 m/s and comes out the far side as a jet, spiraling off into eddies. The tide then goes out and the same happens in reverse, with water shooting out the opposite side.
Conceptual diagram showing the dominant sediment pathways in the Inner Harbour. Source: Meijers (2021).
Due to the sheltered nature of the inlet, waves have only a minor role in sediment transport. However, given the intensity of the tides and the great depths of Burrard Inlet (especially the Indian Arm fjord to the north), most sediment liberated by erosion tends to get carried away from shore and is essentially lost from the coastal sediment budget.
Another key point of her project was to investigate how land use changes and other human effects (e.g., damming rivers, port construction) have changed Burrard Inlet. Using the model, Carlijn showed that these changes to the inlet have shrunken its tidal prism, influencing the currents and sediment transport patterns.
Comparison of the present-day shoreline with the high and low tide lines from 1792, prior to colonization by European settlers. The Second Narrows are so narrow because they were formed by the delta of Seymour River and Lynn Creek. The area has since been dredged and walled off for the construction of the port and to create log booming grounds. Source: Meijers (2021).
These changes are especially evident when we compare satellite photos from the present day with the oldest available images from the 1940s.
Second Narrows in the 1940s and 2021. Please forgive my crappy georeferencing, I eyeballed it. Source: City of Vancouver and Google Earth.
Carlijn wrote an excellent report and capped it all off with one of the best master’s thesis defenses that I’ve seen in a long while. She also handled the cultural context of the project with great respect, interest, and sensitivity. If anyone reading this is looking to recruit a new engineer/researcher with heaps of potential, I cannot recommend Carlijn enough.
All in all, this was a fascinating project and one very close to my heart — I was born in the Vancouver area and was excited to see how the SedTRAILS model could be used in my original backyard. Let’s keep the Delft-Vancouvercollaborations going!
Ebb-tidal deltas are notoriously unpredictable. Battered about by waves and tides, their ever-shifting sands can be a royal pain in the arse for everyone from coastal residents to pirates. I have spent most of the past five years trying to identify the pathways that sand takes across these deltas as part of my PhD. However, the holy grail of ebb-tidal delta research is to take that one step further and make accurate morphodynamic predictions of their evolution on timescales of decades.
This past year, Denzel Harlequin took up the challenge, and I am pleased as punch to announce that last week he successfully defended his master’s thesis, ”Morphodynamic Modelling of the Ameland Ebb-Tidal Delta”. This is a really tricky problem to solve because of the complexity of the processes that need to be simulated.
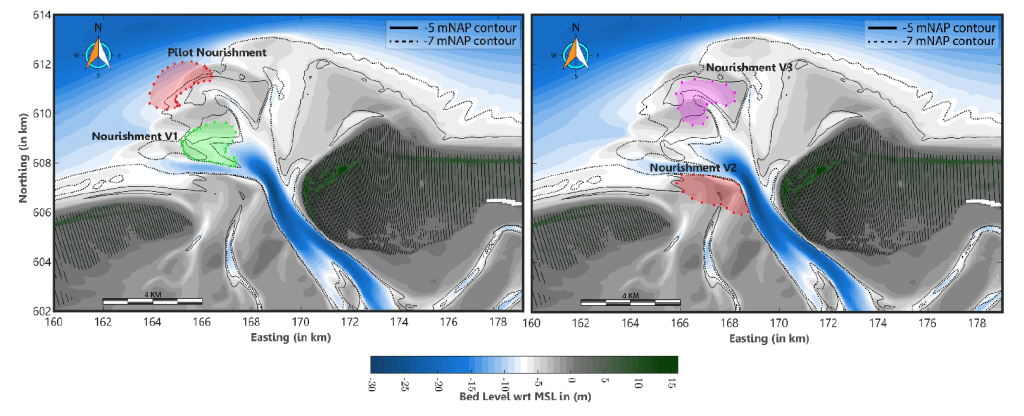
What’s cool about Denzel’s work is that brings us closer to good morphodynamic predictions than we were before. Furthermore, where the predictions deviate from reality, he illuminates the areas where we still need to make improvements — specifically, our representation of wave-driven transports. Denzel also shows how the location of a sand nourishment can have major knock-on effects on the evolution of the ebb-tidal delta.
Different nourishment designs tested by Denzel. If you place the sand in a more dynamic area like a channel, it can have a much wider effect on the rest of the ebb-tidal delta.
Denzel is a very talented modeller and I am delighted that he has joined us as a new colleague in the Applied Morphodynamics department at Deltares. I look forward to many more great collaborations to come!
We forgave Bagnold everything for the way he wrote about dunes. “The grooves and the corrugated sand resemble the hollow of the roof of a dog’s mouth.” That was the real Bagnold, a man who would put his inquiring hand into the jaws of a dog. – Michael Ondaatje, The English Patient
Ralph Bagnold, widely considered one of the godfathers of sediment transport, was a soldier in the British army who spent much of the Second World War scouting around in the Libyan desert. In the process, he learned much about the dynamics of sand dunes, and formed the basis for many theories that are still in use today for explaining how sediment is blown around by wind or water.
This week I am proud of our very own up-and-coming Bagnold, Charlotte Uphues, who successfully defended her thesis, Coastal Aeolian Sediment Transport in an Active Bed Surface Layer, on Thursday. Charlotte did a fantastic job of designing and carrying out her own super cool field experiments, using tracer sediment to estimate aeolian (wind-blown) sediment transport on a beach here in Holland. As the dunes of the Netherlands are a key component to Dutch coastal defenses against flooding, it is essential that we understand better how they evolve by improving our abilities to predict aeolian transport.
I would elaborate a bit more about her findings, but Charlotte will be submitting her thesis for publication in a journal soon, so it will remain under wraps for now. Stay tuned, I don’t think we’ve heard the last from Charlotte!
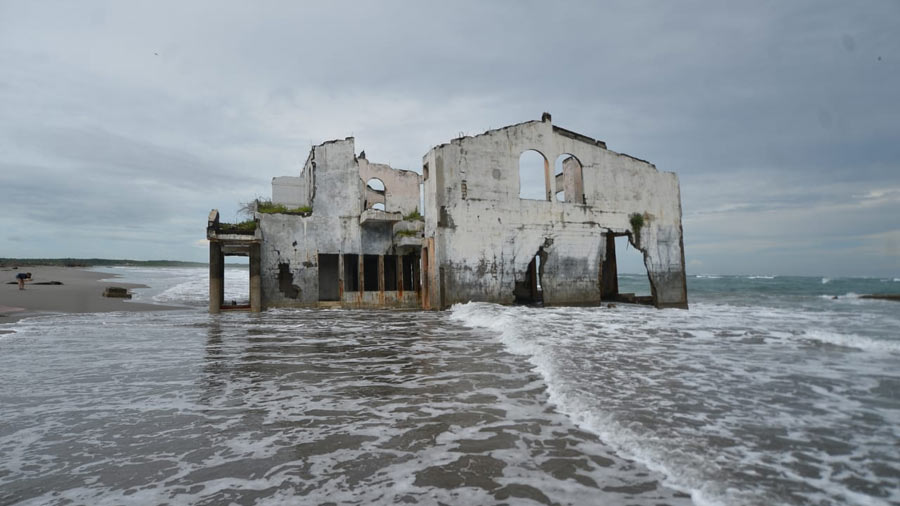
This morning as I was finishing my first coffee, one of my Deltares colleagues shared a video of a house on the beach in El Salvador. It was a surreal, post-apocalyptic, Planet of the Apes scene, made all the more mysterious by the accompanying news text (translated from Dutch): “Abandoned villa washes up entirely on the beach in El Salvador. The ruins of a villa have recently washed up on the beach of La Puntilla in El Salvador. It is a great mystery how the entire house ended up on the beach. Hurricane Elsa may have blown the building away.“
Having spent a fair bit of time professionally contemplating the destructive power of storm-generated waves on tropical coastlines, I was immediately skeptical about this hypothesis. How could a massive concrete structure like that survive such a pummeling and then just “wash up” on a beach?
Being a bunch of sediment transport nerds, my colleagues made all kinds of jokes about building a house-transport module into XBeach or SedTRAILS, or estimating the critical shear threshold and porosity of this giant “particle”. However my curiosity was irrevocably piqued- how did the damn thing get there? It must have been there the whole time, with the coast eroding around that, but how or why?
The Dutch news site was not particularly helpful, so I snooped around on the internet until I found a promising lead in the El Salvadorian news. Apparently the house is located near the village of La Puntilla, on the Pacific coast of El Salvador. Apparently it was a former hotel built (unwisely) right next to the beach. Suffering significant damage during Hurricane Mitch in 1998, it later became a church. Numerous people died in the former hotel and more recently among the ruins, so the building is even spookier than it first seemed. Indeed, after looking in Google Earth, it became apparent that the hotel has been there the entire time:
Before-and-after satellite photos of the abandoned hotel in La Puntilla, showing about 150 m of beach erosion between 2003 and 2021. The dashed line indicates the approximate position of the 2003 shoreline, based on some quick-and-dirty georeferencing and not accounting for potential variations in shoreline position due to the stage of the tidal cycle at the time each photo was taken. The tidal range on 50 km up the coast is about 2 m, so if the beach is very flat, the 2003 shoreline may actually be much closer at high tide.
So the hotel didn’t just “wash up on the beach” one day. But why exactly did it erode so much? Was there a particularly devastating storm? Is climate change or some nefarious human meddling in the coastline to blame? By zooming out a little bit, we can put this coastal erosion into a larger context.
Google Earth is nearly always my first go-to tool for investigating a new site as a coastal engineer — you can learn so much by carefully observing how a given beach or estuary has changed through time, and by looking for evidence of the physical processes shaping the landscape. For instance, white foam usually indicates breaking waves, and by watching how sand piles up in certain places, we can estimate in which direction the sand is mostly moving. What can we learn about this site?
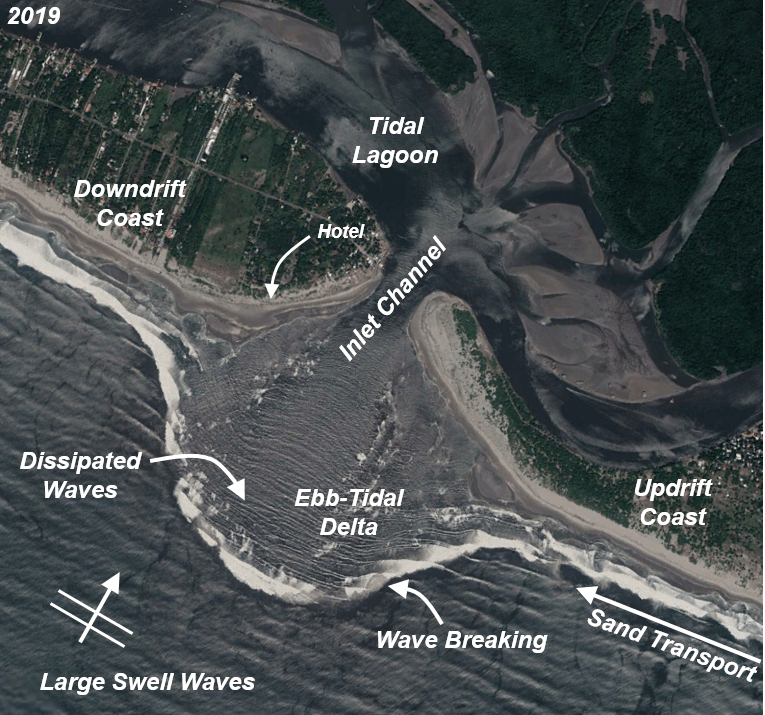
Tidal inlet at La Puntilla, El Salvador. The inlet channel connects the Pacific Ocean to a tidal lagoon, and is fronted by an underwater ebb-tidal delta. Large swell waves travel thousands of kilometers from the stormy south Pacific and break on the ebb-tidal delta (see the white foam), which greatly reduces their size. In this way, the ebb-tidal delta acts like a massive, sandy breakwater. Waves generate currents that push the sand from right to left along the coast, but the sand needs to cross the inlet. It makes this journey in regular spurts that lead to periodic accumulation and erosion of sand along the nearby coasts. This is the fate that befell our poor abandoned hotel.
It seems that the hotel was built on a type of coastal feature that is notorious for massive erosion world-wide: the beach adjacent to a tidal inlet. Tidal inlets connect lagoons with the ocean, the water rushing in and out of them several times a day. The water moves very fast and is stirred up by waves, so it can carry lots of sand and mud to and from the nearby coast. This means that this tidal inlets and the coastlines next to them have the potential to change shape dramatically over time. The inlet channel and smaller channels connected to it have a tendency to migrate back and forth across the underwater ebb-tidal delta like an out-of-control fire hose. If one of these channels is pushed up against the coast, it can cause massive erosion. This seems to be what happened to the abandoned hotel.
If you examine a timelapse in Google Earth (here), the incredibly dynamic nature of this system is apparent:
By a remarkable coincidence, this is the same process that I am investigating in my PhD: how does sediment move around at tidal inlets like this? It is not only the El Salvadorians who need to worry about this process — the topic is also a vital matter of investigation for Dutch coastal management authorities trying to protect their coast. Lesson learned: don’t mess with ebb-tidal deltas!
Ebb-tidal deltas are gigantic piles of sand that form at the seaward mouth of tidal inlets. They are constantly on the move, shifting shape and size in response to the waves and tides. Where exactly is that sand going? This is a question I have been struggling with for the past 5 years during my PhD, and we have recently made great strides in part due to the efforts of Paula Lambregts.
Yesterday, Paula Lambregts successfully defended her master’s thesis, “Sediment bypassing at Ameland inlet“. I had the great honour of co-supervising Paula’s research throughout the last ten or so months, and I am enormously proud of her. Her project encompassed a range of approaches, including bathymetric analysis and numerical modelling, to solve the mystery of the sediment pathways.
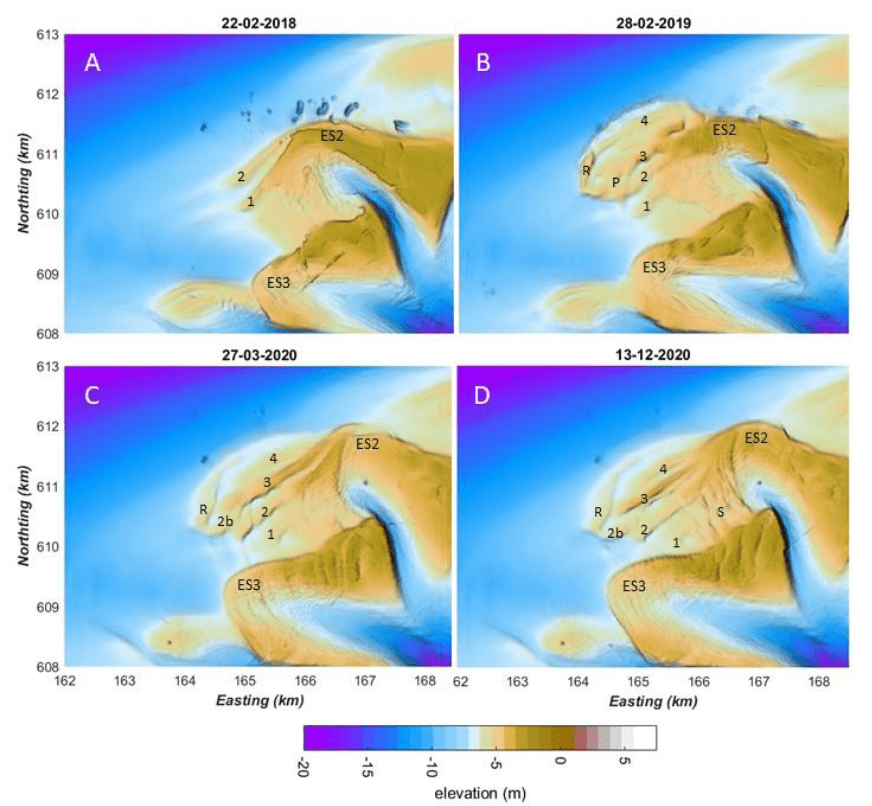
First, Paula’s detective work led her to examine detailed measurements of the seabed bathymetry at Ameland Inlet in the Netherlands, taken over the past fifteen years. These measurements give snapshots of the underwater delta landscape. By comparing the bathymetry from different months or years, we can track the delta’s evolution. In the image below, we see four snapshots of the ebb-tidal delta before and after the construction of a sand nourishment (i.e., the large pile of sand that appears in panel B). This nourishment was a large-scale pilot test to determine if creating sand deposits like this is a viable strategy for strengthening the coast of nearby islands.
Bathymetric maps showing Ameland Ebb-Tidal Delta before (A) and after (B,C,D) the construction of a massive sand nourishment. Paula’s analysis tracked how this nourishment evolved over time, smoothed and smeared out to the east and south east by the combined effects of waves and tides.
After describing how the delta has evolved in the past, Paula developed hypotheses about the physics underlying this behaviour- how do waves and tides move the sand around to create the patterns we observe? To answer this question, she used a combination of computer models to estimate sand transport pathways. This allows us to “connect the dots” and explain how the sand moved from one place to another. The first component was a D-Flow FM model, which is used to simulate the hydrodynamics (waves and tides) and sediment transport (where and how much sand moves). The second component of her modelling approach was to apply SedTRAILS, a brand-new tool developed by my colleagues and I at Deltares for visualizing predicting sediment transport pathways. Using SedTRAILS, she was able to create some really cool maps that indicate where the sand goes.
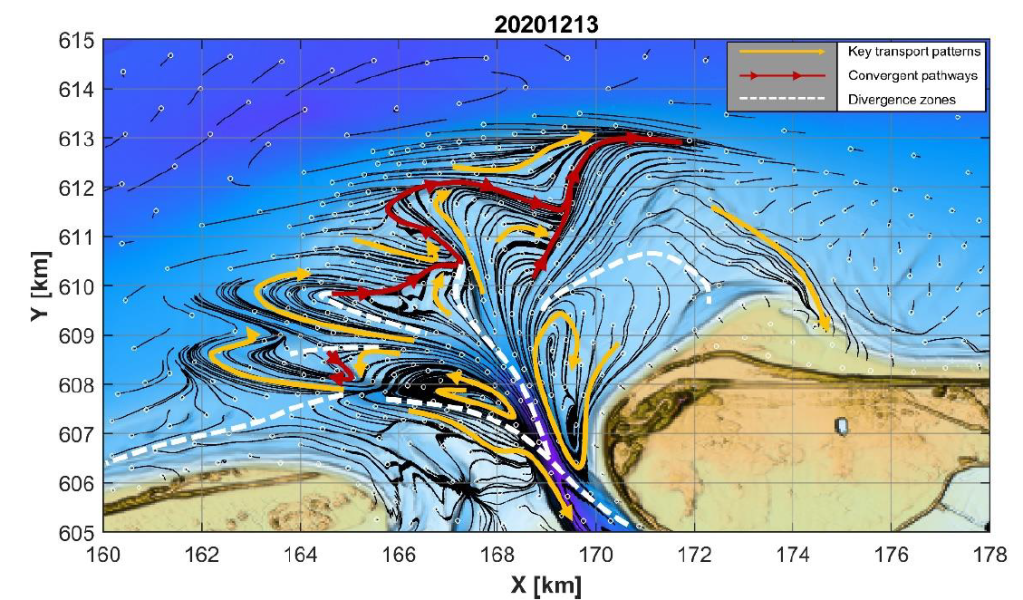
Sediment transport pathways on Ameland ebb-tidal delta in 2020, as visualized using SedTRAILS. The small white circles indicate the source locations of sediment, and thin black lines show the sediment pathways originating from those sources. The yellow lines highlight major transport pathways, and the red lines indicate convergent zones where multiple pathways meet. The white dashed lines indicate divergence zones, where the transport pathways veer away from and (on average) do not cross.
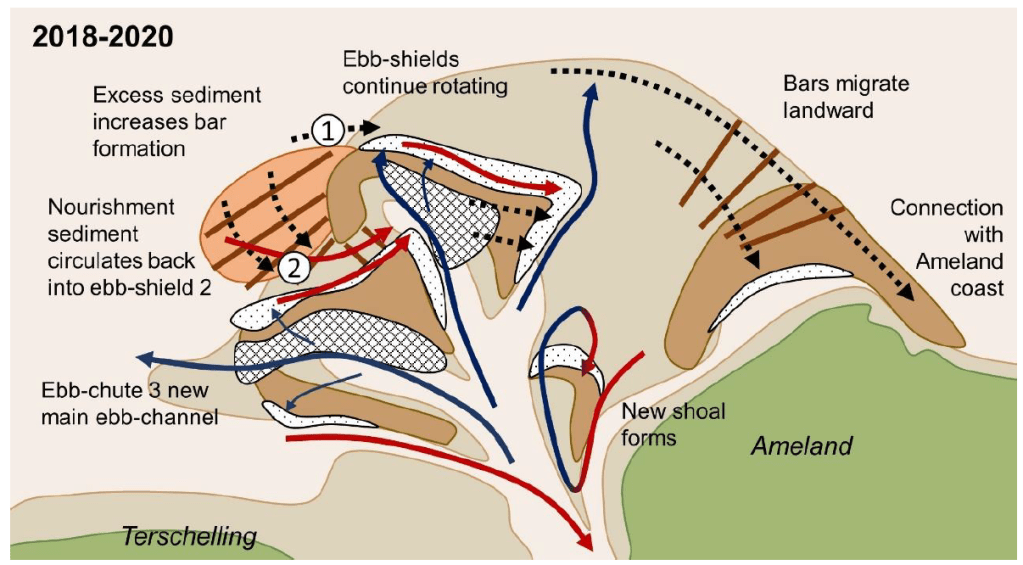
Drawing on her prior expertise in geology, Paula combined those two lines of evidence (the measurements of the seabed and the modelled sediment pathways), to come up with a series of fantastic conceptual diagrams. These diagrams distill the mysterious piles of sand and complex spaghetti of the images above into a more easily understandable picture:
Paula’s conceptual model summarizing all of the different processes shaping Ameland ebb-tidal delta in 2020. Check out her thesis to see the complete evolution over the past 15 years!
The work that she did is extremely valuable for coastal management, since it gives more insight into where (and where not!) to construct sand nourishments. It also brings new insights to science about how these complex systems work. Last of all, it is enormously helpful for the research that we are continuing to do at TU Delft and Deltares. In September I will continue on with the work on sediment transport pathways at tidal inlets begun during my PhD, and build on the work that Paula has carried out in her thesis project. I am extremely proud of her and hope that we can continue to collaborate in the future!
I love lighthouses, and am borderline obsessed with them. I have lucky lighthouse socks (I’m wearing them today), I own books about them, and in high school I made a papier-mâché lighthouse lamp. I have spent hours in the rain trying to photograph them during storms. Furthermore, they are most often found in places where the sea is at its most violent, and from a technical perspective, most interesting.
Naturally, when a bright master’s student from our lab asked if I was interested in joining his thesis committee to research the impact of breaking waves on lighthouses, I could not help but say yes. My research on coral reefs focuses mainly on the complex ways in which waves change as they break across the reef. In many ways, this is a similar process to what happens when waves hit the rocky shoals that many lighthouses are built on. This makes for a compelling intersection between my professional interests and private obsessions!
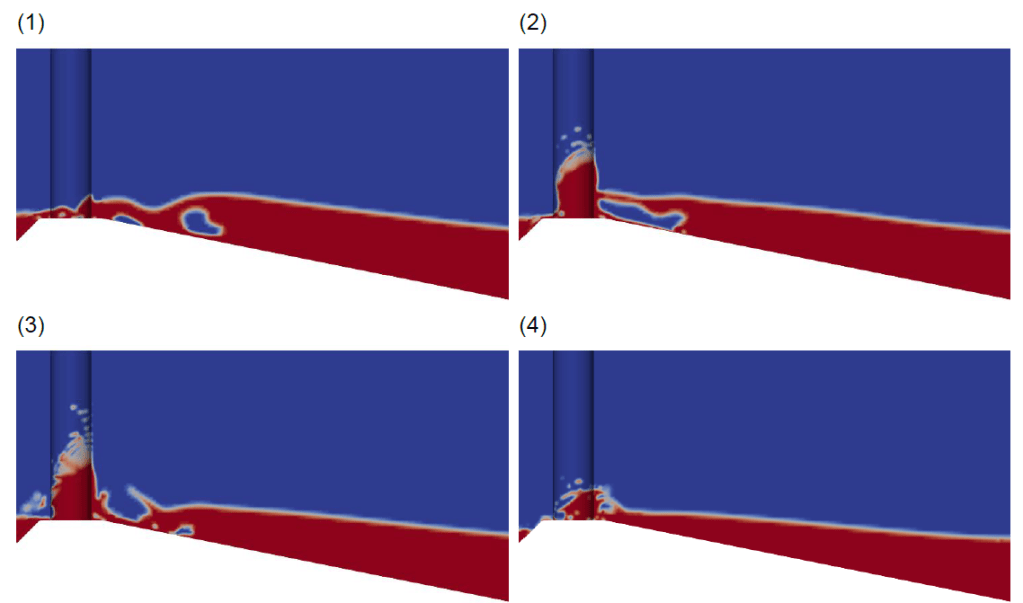
Simulation of a wave breaking on a rocky shoal and then colliding with a lighthouse, from Jan van Gorsel’s thesis. The blue represents air and the red water. It is really hard to predict something like this, because of the complex bouncing and splashing motion of the broken wave. Simulating this process is a bit like trying to predict the exact spatial distribution of spilled beer after a drunk guy stumbles and trips in a crowded pub. Sigh. Remember crowded pubs?Continue reading Lighthouse Fever
Coral reefs and the islands that they protect from flooding are in big trouble. This is arecurringthemeon thisblog, and now it’s time for the latest update. We are currently building towards the development of an early flood warning system for low-lying tropical islands fronted by coral reefs. Our previous work on this topic has focused on finding ways to do this accurately for a wide variety of coral reef shapes and sizes, as well as different wave and sea level conditions. However, it’s not enough to be accurate- to deliver timely early warnings, you also need to be fast.
That’s where the latest research of Vesna Bertoncelj comes in.
Vesna’s research provides us with new approaches for making highly accurate predictions of coastal flooding, at limited computational expense. The numerical models that we use to estimate flooding often take a long time to simulate, since they resolve many complex physical processes at high resolution in space and time. However, by paring down these models to only the most essential components for the task at hand, we can do this much faster. My colleagues at Deltares recently developed the SFINCS model, which has been successfully used to predict flooding in a fraction of the time that our standard models take. But how do we put all these different pieces together?
A schematic overview of Vesna’s research methodology. [Source].
First, Vesna established a baseline for model performance by running a computationally intensive XBeach Non-Hydrostatic model (XB-NH+), and a much faster SFINCS model. These models provide an estimate for runup (R2%), which can be taken as a proxy for coastal flooding. In the second step, she used a lookup table (LUT) of pre-computed XBeach model output and to derive the input for the SFINCS model. The crucial task is doing this quickly and accurately, so she experimented with different interpolation techniques for deriving that input. She then compared her new approach with the standard models to find the fastest and most accurate combination.
Her research gives us a useful methodology that we can implement to speed up our early flood warning system, saving time and hopefully someday saving lives.
Vesna’s quality of work is excellent and she has a fantastic attitude towards research and collaboration. Her curiosity, professionalism, and diligence will undoubtedly serve her well in the years to come. I hope that we will have other opportunities to collaborate in the future. If anybody out there needs a bright young coastal researcher and/or modeller, hire her!
We frequently hear in the news about dying coral reefs, and also about the threats of sea level rise and climate change. But there is a key gap: what if we can hit two birds with one stone, and restore damaged ecosystems while providing vital protection against flooding? Our latest research demonstrates how coastal managers and ecologists can join forces to achieve both goals, which may help stretch limited funding further.
I am extremely proud to share Floortje Roelvink’s first scientific paper, “Coral reef restorations can be optimized to reduce coastal flooding hazards“, published in Frontiers of Marine Science. I had the great privilege of sitting on her MSc thesis committee two years ago, and she has been our colleague at Deltares ever since.
At TU Delft, a requirement for our PhD defense is to make ten propositions based on what we have learned during the previous years. Claims posed by my friends and colleagues deal with the nitty gritty details (“All diffusive processes can be derived from an advective one, and failing to do so yields incorrect modelling“[1]) but also the bigger picture of how we do what we do (“The way morphological models are presented and interpreted has a lot in common with predictions of snow depth in five years on December 26th at 4pm. The knowledge in these models deserves a better presentation“[2]).
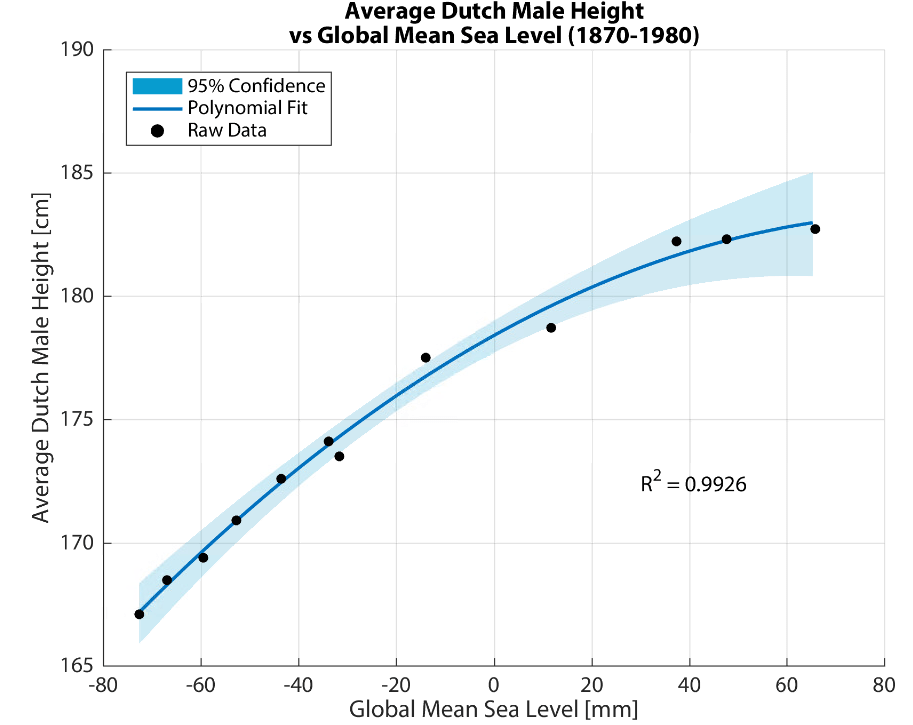
The propositions must be both defendable and opposable, so as to stimulate an interesting debate during the defense. Some of the propositions should reflect the findings of our research, but it is also traditional to include statements that have nothing to do with it. One colleague[3] even suggested (tongue in cheek) that the increase in the height of Dutch men over time could be explained by sea level rise. I couldn’t resist analyzing the data myself, and the results were surprisingly good:
Spurious correlation of the week! As John von Neumann said, “With four parameters I can fit an elephant, and with five I can make him wiggle his trunk.”
These propositions are a chance to inject a bit of last-minute philosophizing into our Doctorates of Philosophy, and range from the wise (“No wind is favourable if a person does not know to what port (s)he is steering – Seneca“[4]) to the downright cheeky (“This proposition is not opposable“[1]).
What I Learned by Counting Sand for 5 Years
As the clock is ticking on my own PhD (259 days, 13 hours, 39 minutes, and 51 seconds, but who’s counting? *eye twitches*), I started preparing some propositions of my own (obviously in a fit of procrastination on my dissertation). After nearly five years of scrutinizing sand and contemplating connectivity, my research has led me to an inescapable conclusion:
Ebb-tidal deltas are badass morphological features (BAMFs), (c.f. Phillips [2015]).
What, pray tell, is an ebb-tidal delta, and why is it so badass? Ebb-tidal deltas are large underwater piles of sand at the mouth of estuaries and tidal inlets, deposited by outflowing tides and reshaped by waves. I spend my days studying how waves and tides move sand around on the Ameland ebb-tidal delta in the northern part of the Netherlands (see below). We need to know this in order to plan ecologically-sustainable flood protection measures for the Dutch coast. A morphological feature is just a fancy name for some part of a landscape, like a hill or a valley or a beach.
An ebb-tidal delta is the giant pile of sand located at the mouth of a tidal inlet like this one. This may not sound glamorous, but understanding the way it moves around is extremely important for ensuring safe navigation and for predicting erosion and flooding of adjacent coasts.
What makes a badass “badass”?
Phillips[5] defines the archetypal badass as “individualistic, non-conformist, and able to produce disproportionate results”, and applies this concept to geomorphology (the study of how landscapes evolve, at the crossroads of geology and physical geography). Ebb-tidal deltas meet these three criteria, which makes them badass morphological features (BAMFs):
Ebb-tidal deltas are each unique (in shape, location, composition, and in terms of the environmental forces shaping them (like waves and tides)), and hence individualistic.
Ebb-tidal deltas are chaotic systems which defy accurate prediction using physics-based numerical models[6], and hence are non-conformist or “naughty”[7]. This numerical naughtiness is a serious problem for coastal engineers and scientists, since a failure to accurately predict ebb-tidal delta evolution can threaten public safety and lead to costly property or infrastructure damage. They do not “play by the rules” of our existing physics-based deterministic models.
Ebb-tidal deltas are highly nonlinear systems which can greatly amplify small instabilities[8], and hence produce disproportionate results.
In addition to the strict definitions of Phillips[5], ebb-tidal deltas are also “belligerent or intimidating, ruthless, and tough”, other traits reflective of badassery [Oxford Engish Dictionary]. The Columbia River ebb-tidal delta alone is responsible for dozens shipwrecks in the past century, and Ameland ebb-tidal delta has also featured numerous wrecks throughout its history.
Quoting Thomas Pynchon[9], Phillips also notes that badasses are “able to work mischief on a large scale”. Ameland ebb-tidal delta covers an area of approximately 100 square kilometers, roughly the size of The Hague. Many ebb-tidal deltas around the world are even larger!
Seriously?
Now admittedly, ebb-tidal deltas are just big piles of sand. A big pile of sand is probably not the first thing that comes to mind when you hear the word “badass”, unless you are Ralph Bagnold or a Sarlacc. This could probably also be considered gratuitous personification or anthropomorphization.
I’m sure that many of my friends and family have been scratching their heads as to why I would sacrifice the latter half of my 20s to understand them better. A critical reader might ask, “is it possible that you have only convinced yourself that ebb-tidal deltas are cool out of self-preservation?” And the answer is yes. Yes, I have. Nonetheless, I remain steadfast in my assertion that ebb-tidal deltas exhibit major symptoms of geomorphological badassery.
Although the concept of geomorphological badassery may seem silly at first, it illuminates several important truths of our (mis)understanding of these complex bathymetric features. Ebb-tidal deltas are important to study for reasons of coastal flood protection, navigational safety, and ecological value, but we are bad at predicting how they will evolve. This is because each ebb-tidal delta is unique, making it challenging to generalize their behavior. Furthermore, their chaotic, non-conformist behavior renders many of our usual deterministic prediction techniques ineffective. Lastly, the amplifying effect of highly nonlinear physical processes means that small physical changes (e.g., the development of a tiny shoal) could have disproportionately large consequences (e.g., relocation of a channel several kilometers wide). As such, badassery provides a useful conceptual framework for describing the challenges presented by ebb-tidal deltas to coastal engineers and scientists.


