We forgave Bagnold everything for the way he wrote about dunes. “The grooves and the corrugated sand resemble the hollow of the roof of a dog’s mouth.” That was the real Bagnold, a man who would put his inquiring hand into the jaws of a dog. – Michael Ondaatje, The English Patient
Ralph Bagnold, widely considered one of the godfathers of sediment transport, was a soldier in the British army who spent much of the Second World War scouting around in the Libyan desert. In the process, he learned much about the dynamics of sand dunes, and formed the basis for many theories that are still in use today for explaining how sediment is blown around by wind or water.
This week I am proud of our very own up-and-coming Bagnold, Charlotte Uphues, who successfully defended her thesis, Coastal Aeolian Sediment Transport in an Active Bed Surface Layer, on Thursday. Charlotte did a fantastic job of designing and carrying out her own super cool field experiments, using tracer sediment to estimate aeolian (wind-blown) sediment transport on a beach here in Holland. As the dunes of the Netherlands are a key component to Dutch coastal defenses against flooding, it is essential that we understand better how they evolve by improving our abilities to predict aeolian transport.
I would elaborate a bit more about her findings, but Charlotte will be submitting her thesis for publication in a journal soon, so it will remain under wraps for now. Stay tuned, I don’t think we’ve heard the last from Charlotte!
Ebb-tidal deltas are gigantic piles of sand that form at the seaward mouth of tidal inlets. They are constantly on the move, shifting shape and size in response to the waves and tides. Where exactly is that sand going? This is a question I have been struggling with for the past 5 years during my PhD, and we have recently made great strides in part due to the efforts of Paula Lambregts.
Yesterday, Paula Lambregts successfully defended her master’s thesis, “Sediment bypassing at Ameland inlet“. I had the great honour of co-supervising Paula’s research throughout the last ten or so months, and I am enormously proud of her. Her project encompassed a range of approaches, including bathymetric analysis and numerical modelling, to solve the mystery of the sediment pathways.
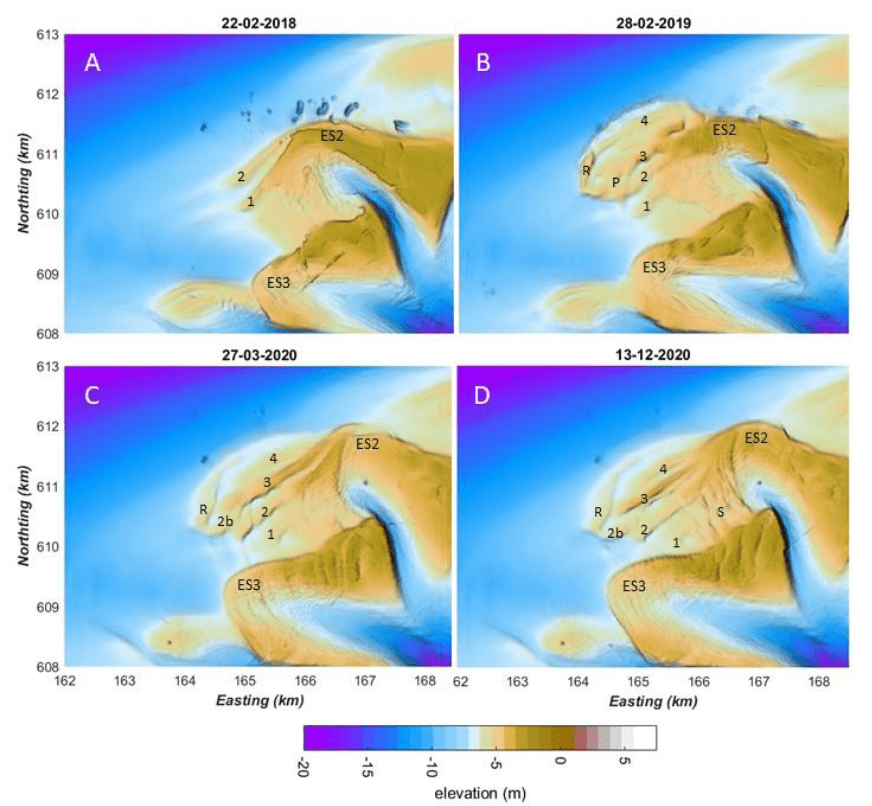
First, Paula’s detective work led her to examine detailed measurements of the seabed bathymetry at Ameland Inlet in the Netherlands, taken over the past fifteen years. These measurements give snapshots of the underwater delta landscape. By comparing the bathymetry from different months or years, we can track the delta’s evolution. In the image below, we see four snapshots of the ebb-tidal delta before and after the construction of a sand nourishment (i.e., the large pile of sand that appears in panel B). This nourishment was a large-scale pilot test to determine if creating sand deposits like this is a viable strategy for strengthening the coast of nearby islands.
Bathymetric maps showing Ameland Ebb-Tidal Delta before (A) and after (B,C,D) the construction of a massive sand nourishment. Paula’s analysis tracked how this nourishment evolved over time, smoothed and smeared out to the east and south east by the combined effects of waves and tides.
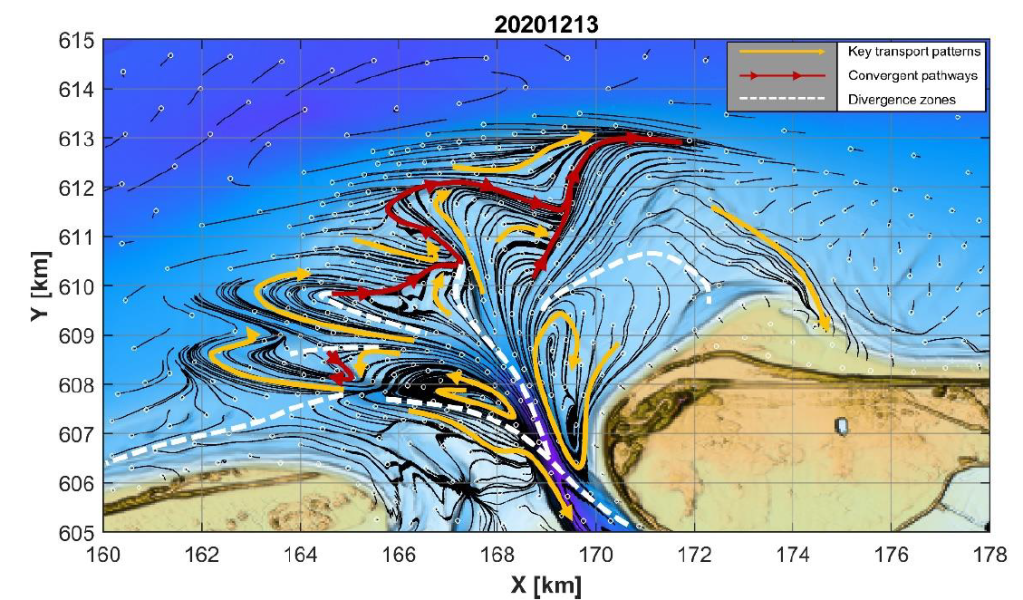
After describing how the delta has evolved in the past, Paula developed hypotheses about the physics underlying this behaviour- how do waves and tides move the sand around to create the patterns we observe? To answer this question, she used a combination of computer models to estimate sand transport pathways. This allows us to “connect the dots” and explain how the sand moved from one place to another. The first component was a D-Flow FM model, which is used to simulate the hydrodynamics (waves and tides) and sediment transport (where and how much sand moves). The second component of her modelling approach was to apply SedTRAILS, a brand-new tool developed by my colleagues and I at Deltares for visualizing predicting sediment transport pathways. Using SedTRAILS, she was able to create some really cool maps that indicate where the sand goes.
Sediment transport pathways on Ameland ebb-tidal delta in 2020, as visualized using SedTRAILS. The small white circles indicate the source locations of sediment, and thin black lines show the sediment pathways originating from those sources. The yellow lines highlight major transport pathways, and the red lines indicate convergent zones where multiple pathways meet. The white dashed lines indicate divergence zones, where the transport pathways veer away from and (on average) do not cross.
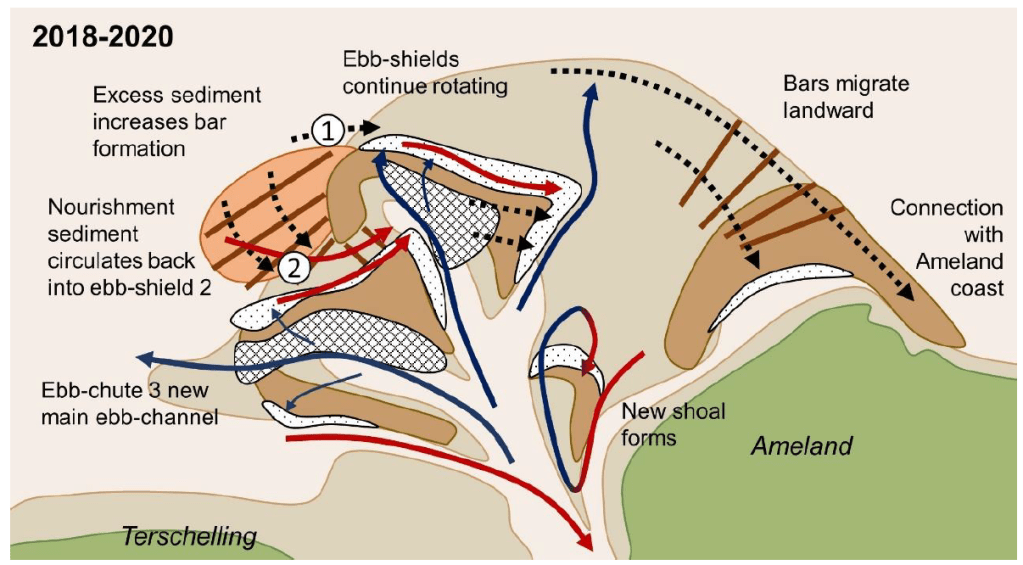
Drawing on her prior expertise in geology, Paula combined those two lines of evidence (the measurements of the seabed and the modelled sediment pathways), to come up with a series of fantastic conceptual diagrams. These diagrams distill the mysterious piles of sand and complex spaghetti of the images above into a more easily understandable picture:
Paula’s conceptual model summarizing all of the different processes shaping Ameland ebb-tidal delta in 2020. Check out her thesis to see the complete evolution over the past 15 years!
The work that she did is extremely valuable for coastal management, since it gives more insight into where (and where not!) to construct sand nourishments. It also brings new insights to science about how these complex systems work. Last of all, it is enormously helpful for the research that we are continuing to do at TU Delft and Deltares. In September I will continue on with the work on sediment transport pathways at tidal inlets begun during my PhD, and build on the work that Paula has carried out in her thesis project. I am extremely proud of her and hope that we can continue to collaborate in the future!
Coral reefs and the islands that they protect from flooding are in big trouble. This is arecurringthemeon thisblog, and now it’s time for the latest update. We are currently building towards the development of an early flood warning system for low-lying tropical islands fronted by coral reefs. Our previous work on this topic has focused on finding ways to do this accurately for a wide variety of coral reef shapes and sizes, as well as different wave and sea level conditions. However, it’s not enough to be accurate- to deliver timely early warnings, you also need to be fast.
That’s where the latest research of Vesna Bertoncelj comes in.
Vesna’s research provides us with new approaches for making highly accurate predictions of coastal flooding, at limited computational expense. The numerical models that we use to estimate flooding often take a long time to simulate, since they resolve many complex physical processes at high resolution in space and time. However, by paring down these models to only the most essential components for the task at hand, we can do this much faster. My colleagues at Deltares recently developed the SFINCS model, which has been successfully used to predict flooding in a fraction of the time that our standard models take. But how do we put all these different pieces together?
A schematic overview of Vesna’s research methodology. [Source].
First, Vesna established a baseline for model performance by running a computationally intensive XBeach Non-Hydrostatic model (XB-NH+), and a much faster SFINCS model. These models provide an estimate for runup (R2%), which can be taken as a proxy for coastal flooding. In the second step, she used a lookup table (LUT) of pre-computed XBeach model output and to derive the input for the SFINCS model. The crucial task is doing this quickly and accurately, so she experimented with different interpolation techniques for deriving that input. She then compared her new approach with the standard models to find the fastest and most accurate combination.
Her research gives us a useful methodology that we can implement to speed up our early flood warning system, saving time and hopefully someday saving lives.
Vesna’s quality of work is excellent and she has a fantastic attitude towards research and collaboration. Her curiosity, professionalism, and diligence will undoubtedly serve her well in the years to come. I hope that we will have other opportunities to collaborate in the future. If anybody out there needs a bright young coastal researcher and/or modeller, hire her!
We frequently hear in the news about dying coral reefs, and also about the threats of sea level rise and climate change. But there is a key gap: what if we can hit two birds with one stone, and restore damaged ecosystems while providing vital protection against flooding? Our latest research demonstrates how coastal managers and ecologists can join forces to achieve both goals, which may help stretch limited funding further.
I am extremely proud to share Floortje Roelvink’s first scientific paper, “Coral reef restorations can be optimized to reduce coastal flooding hazards“, published in Frontiers of Marine Science. I had the great privilege of sitting on her MSc thesis committee two years ago, and she has been our colleague at Deltares ever since.
In an era of rising sea levels, ambitious plans for coastal protection works are emerging around the world. One such plan is the Delta21 project, proposed by group of Dutch coastal engineers and entrepreneurs. Their goal is to improve flood protection at the mouth of the Haringvliet estuary and develop a tidal power facility, all in one integrated project.
However, the law of unintended consequences often looms large in these sorts of massive infrastructure projects, particularly for environments as complex as estuaries. After a massive flood in 1953, the Dutch constructed the Delta Works, damming most of the estuaries in the southern half of the Netherlands. Prior to that, the Afsluitdijk was constructed across the Zuiderzee in the northern part of the country. These protection works have had dramatic consequences on the physical and ecological development of the Dutch coast, and manyofmycolleagues here have devoted their careers to analyzing the impact of these interventions.
But instead of just looking back and dissecting the successes and failures of 50 or 100 years past, what if we could also use our latest diagnostic tools for predicting the potential impact of bold future interventions? If the Delta21 plan goes ahead, how will the mouth and ebb-tidal delta of the Haringvliet estuary and surrounding coastline evolve? Will existing habitats (particularly in vital intertidal areas) be preserved, disappear, or even expand?
Today, Mayra Zaldivar Piña tackled these questions head on, and successfully defended her master’s thesis, “Stability of intertidal and subtidal areas after Delta21 plan“. I had the pleasure of co-supervising Mayra’s work throughout the last eight or so months, and am very proud of her. She embarked on a challenging modelling project and showed an exemplary critical scientific attitude. I was also so impressed with the persistence and tenacity she showed in doing nearly her entire project during the pandemic. Writing your thesis is a difficult and isolating experience at the best of times, and these are not the best of times. Nonetheless, she kept at it and delivered an impressive thesis in the end!
Congratulations Mayra, and best of luck in the next steps of your career!
Small island developing states around the world are especially vulnerable to the hazards posed by sea level rise and climate change. As engineers, we have a number of tools in our toolbox for reducing the risk posed by coastal flooding and for planning adaptation measures. We often rely on predictive models which combine information about expected wave and sea level conditions, the topography of the coast, and vulnerable buildings and population to estimate potential flooding and expected damage.
However, to use these types of models, we first need to answer a lot of questions: what exactly are the expected wave and sea level conditions? What if detailed topographic measurements are unavailable? What if the population of a given coastal area increases? How are the local buildings constructed, and what are the consequences of that for estimating damage from flooding?
If our information is imperfect (which it almost always is), all is not lost: we can still make educated guesses or test the sensitivity of our models to a range of values. However, these uncertainties can multiply out of control rather quickly, so we need to be able to quantify them. There is no sense in spending the time to develop a detailed hydrodynamic model if your bathymetry data is crap. Can we get a better handle on which variables are the most important to quantify properly? Can we prioritize which data is the most important to collect? This would help us make better predictions, and to make better use of scarce resources (data collection is expensive, especially on remote islands!).
Based on a study of the islands of São Tomé and Príncipe, off the coast of Africa, Matteo found that topographic measurements and the relationship between flood depth and damage to buildings were the biggest uncertainties for predicting present-day flood damage. This means that measuring topography of vulnerable coastal areas in high resolution, and performing better post-disaster damage surveys will provide the best “bang for your buck” right now. However, for longer time horizons (i.e. the year 2100), uncertainty in sea level rise estimates become most important.
Matteo’s work will help coastal managers on vulnerable islands to better prioritize limited financial resources, and will improve the trustworthiness of our predictive models. Great job, Matteo!
Coral reefs around the world are dying; that much is clear from the headlines we see in the news that grow increasingly distressed with each passing year. This is an ecological catastrophe, but are we also losing another key benefit of reefs? Coral reefs provide a form of natural protection against wave-driven flooding on tropical coastlines. This is partly because the physical form of the reef (often a big rocky shelf) serves as a sort of natural breakwater, but is also due to the frictional effects of the corals themselves.
Many species of coral have complex shapes that disrupt the flow of water across reefs, generating turbulence and dissipating energy. This has the effect of reducing the height of waves as they travel across the reef towards the shore. However, these effects are incredibly complex and poorly understood, so we usually just simplify them in our predictive models by considering a reef to be more “hydraulically rough” than a sandy beach, for example. But we need to do better: these models are used to forecast flooding and estimate the impact of future climate change on vulnerable coasts.
How can we improve this? In coastal engineering, we often conduct experiments in the laboratory to test our theories and understand the chaos of natural systems in more controlled settings. What if we could make a scale model of a coral reef and measure exactly how waves are dissipated?
I am extremely proud to announce the graduation of Paul van Wiechen, one of the Master’s students whom I have had the pleasure of supervising. Yesterday, he defended his thesis, “Wave dissipation on a complex coral reef: An experimental study“, where he built a tiny coral reef in the TU Delft wave flume (a 30-m long bathtub with a wave-making paddle at one end) using hundreds of 3D-printed coral models.
It was one of the coolest projects I have ever seen, and his research provides us with valuable measurements that give us a deeper understanding of the vital role that corals play in protecting our coasts.
He also did all of this in the middle of a global pandemic, and somehow managed to stay completely on schedule. We are very lucky, because Paul will be joining the Coastal Engineering department here at TU Delft to start a PhD on dune erosion this fall. We are all glad to have him on the team and eager to see what his research unveils next!
Many of the world’s idyllic tropical coasts are facing threats on multiple fronts. Rising seas threaten the very habitability of many low-lying islands, and the coral reefs that often defend these coasts from wave attack are dying, too. Compounding this problem is the sheer number and variety of these islands: there are thousands of islands, and the coral reefs surrounding them come in all shapes and sizes. Located around the globe, these islands are each exposed to a unique wave climate and range of sea level conditions. This variability in reef characteristics and hydrodynamic forcing makes it a big challenge to forecast how waves will respond when they approach the shore, something that is quite tricky even at the best of times. Under these circumstances, how can we protect vulnerable coastal communities on coral reef coasts from wave-driven flooding?
This is the problem that our fantastic former student, Fred Scott (now at Baird & Associates in Canada), tackled in his paper, Hydro-Morphological Characterization of Coral Reefs for Wave Runup Prediction, recently published in Frontiers in Marine Science. Working in partnership with Deltares and the US Geological Survey for his master’s thesis, Fred came up with a new methodology for forecasting how waves transform in response to variations in the shape and size of coral reefs.
(A) This is a typical fringing coral reef cross-section, showing waves approaching from the right, with the shore on the left. (B) Fred came up with a number of algorithms for classifying and organizing the massive dataset of coral reef cross-sections. (C) The measurements used in our study are from sites around the globe. (D) This is what 30,000 reef cross-sections look like when you try to plot them all on top of one another- clearly we need to whittle those down a bit… [Source: Scott et al, 2020]In our previous research on this topic, we tried to predict flooding on coral reef-lined coasts using a very simplified coral reef shape. This was fine as a first guess, but most reefs are bumpy and jagged and bear little resemblance to the unnaturally straight lines in my model. We couldn’t help it though: there just wasn’t enough data available when I started my thesis four years ago, so we did the best we could with the information we had at the time. On the bright side, using a single simple reef shape meant that we could easily run our computer simulations hundreds of thousands of times to represent a wide range of wave and relative sea level conditions.
Fast forward three years to when Fred began his own thesis. We now had access to a mind-boggling dataset of over 30,000 measured coral reef cross-sections from locations around the world! However, instead of too little data, we now had too much! If we wanted to simulate a whole range of wave and sea level conditions on each of the reefs in our dataset, it might take months or even years to run our models! Fred had the daunting task of distilling that gargantuan database down to a more manageable number of reef cross-sections.
But how do we choose which cross-sections are the most useful or important to look at? Even though every coral reef is, like a beautiful snowflake, utterly unique, surely there must be some general trends or similarities that we can identify, right? This question lies at the heart of Fred’s research, and to answer it, he turned to many of the same powerful statistical and machine-learning techniques used by the likes of Google and Facebook to harvest your life’s secrets from the internet or power self-driving cars. Maybe we can use some of this technology for good, after all!
The main approach that Fred used in this study was cluster analysis, a family of techniques that look for similarities or differences between entries in a dataset, and then group the entries accordingly into clusters. The entries within one cluster should be more similar to each other than to the entries in other clusters. In our case, this meant grouping the reefs into clusters by similar shape and size. This allowed us to increase efficiency and reduce redundancy by proceeding with 500 representative cross sections, instead of the entire database of 30,000.
These days when I’m lonely, I Zoom with 500 of my favourite coral reef profiles…
Other studies in our field have tried similar approaches (such as this Brazilian study of coral reef shape), but the innovative part of Fred’s technique was to also account for similarities in the hydrodynamic response of the waves to each reef via a second round of clustering. Wave transformation on coral reefs can be immensely complicated, so it is entirely possible that two reef profiles could look very different, but lead to the same amount of flooding in the end. Since we are mainly concerned about the flooding (rather than a classification for ecological or geological purposes about coral reef formation and evolution), this suits us just fine!
In the end, Fred was able to distill this colossal dataset into between 50-312 representative cross sections that can forecast wave runup with a mean error of only about 10%, compared to predictions made using the actual cross sections. This opens the door wide for a range of future applications, such as climate change impact assessments or coral reef restoration projects. Right now, we are working on a new project that will apply Fred’s approach to the development of a simplified global early-warning system for wave-induced flooding on coral reef-fronted coasts.
Great work, Fred, and congratulations on your first publication! I am excited to see where this road takes us!
Sources:
Scott, F., Antolinez, J.A.A., McCall, R.C., Storlazzi, C.D., Reniers, A.J.H.M., & Pearson, S.G. (2020). Hydro-morphological characterization of coral reefs for wave-runup prediction. Frontiers in Marine Science. [Link]
Scott, F. (2019). Data reduction techniques of coral reef morphology and hydrodynamics for use in wave runup prediction. [Link]. TU Delft MSc thesis in cooperation with Deltares and the US Geological Survey.
Scott, F., Antolinez, J.A., McCall, R.T., Storlazzi, C.D., Reniers, A., and Pearson, S., 2020, Coral reef profiles for wave-runup prediction: U.S. Geological Survey data release [Link].
What pathways does sediment take as it travels through an estuary? Yesterday, Laurie van Gijzen defended her thesis, entitled “Sediment Pathways and Connectivity in San Francisco South Bay“. Laurie is one of the master’s students that I supervise, and she has done a great job on this project.
San Francisco Bay is a massive estuary, with over six million people living nearby. In addition to San Francisco, Silicon Valley sits on its shores. Some of the biggest tech companies in the world like Google and Facebook have their head offices right next to the Bay. For over 150 years, the ecological health of the bay has deteriorated, in part due to land reclamations and contaminated sediment from gold mining. The dynamics of San Francisco thus have a huge economic, social, and environmental impact.
Laurie’s work focused on calibrating and improving a sediment transport model of the bay, in order to track the pathways of fine sediment (i.e., mud). She worked with a notoriously fickle model (DELWAQ) and succeeded in greatly improving its calibration.
Laurie’s thesis summarized into a single diagram (Figure 6.1 from her report). She shows the dominant sediment pathways as dark arrows, and the net accumulation (import, in orange) or depletion (export, in blue). Also indicated are the dominant physical processes responsible for sediment transport in the different parts of the bay. The baroclinic processes mentioned here are currents resulting from density differences in seawater due to changes in salinity and temperature.
Another cool thing about her work is that Laurie was the first person to apply the coastal sediment connectivity framework that I have been developing! She was able to use this to identify key transport pathways and critical locations in the bay. It was extremely helpful for my research, as it gives us a proof of concept that our framework is applicable to multiple sites and can tell us something useful.
Her work was also accepted for a presentation at the NCK Days conference, which was meant to be held this week in Den Helder, but was cancelled due to ongoing societal chaos. Great job, Laurie!