Today is Liberation Day in the Netherlands, and marks the 75th anniversary of their liberation at the end of World War II. There were many Canadians involved in that operation, so today is often marked by celebrations of Dutch-Canadian friendship on both sides of the Atlantic. Since I can’t actually celebrate anything with my Dutch friends these days, I instead offer up this poem:
Due to my non-Dutch upbringin’
I can’t speak the language they sing in
So I took a Dutch course
Now I make my voice hoarse
As I try to pronounce Scheveningen
I really need help with my Dutch
Since I currently lack the right touch
I don’t mean to sound terse
But I just can’t converse
Though I like writing poems very much!
Your regularly-scheduled coastal science and engineering-themed blog posts will resume… eventually…
Majuro is an atoll island in the Marshall Islands, located in the middle of the Pacific, just north of the equator. With 20,000 people packed into less than 10 square kilometres, it is one of the most densely-populated islands on earth. It is also in big trouble: with an average elevation of only 3 m above sea level, Majuro faces serious risks of flooding. They can’t “head for the hills”, because there are none. The threat of drowning under rising seas looms on the horizon, but many low-lying tropical islands like Majuro will be rendered uninhabitable not within centuries but within mere decades due to flooding by waves.
Predicting these floods and planning appropriate measures to mitigate their impact is thus a matter of life or death for people living on these islands. My previouswork on this topic considered only “sunny day” floods due swell waves generated by distant storms. Tije’s thesis took the next step and focused specifically on predicting compound floods: the combined effects of flooding due to waves and rain. On top of that, Tije took on the much more challenging task of predicting the massive and volatile typhoons that can clobber a small island like Majuro.
The methods he developed will be very useful not just for Majuro, but also for other vulnerable islands. Given its relevance and novelty, we hope to publish it as a paper in the coming months. Great job, Tije!
A few weeks ago, I was reading a book about glaciology recently when a sentence caught my eye. Many advances in our understanding of how glaciers developed and transformed our world during the last ice age came from studying the Canadian landscape. In particular:
A benchmark example [of paleo ice sheet reconstruction] was the compilation of the first Glacial Map of Canada in 1959, followed by its update in 1968, by the Geological Survey of Canada, based on painstaking aerial photograph and field mapping by its officers on a map sheet by map sheet basis after the completion of the aerial photograph coverage for the whole country in the 1950s.
This caught my eye, because I knew that my Grandpa on my Dad’s side of the family was a pilot who flew a lot of aerial surveys for the Canadian government in the late 50s. I mentioned this to my Dad, just thinking he’d say, “gee, that’s cool”, and move on. Apparently that triggered something in him though, because a few days later my email inbox was filled with a treasure trove of old family photos that I had never seen before. In recent years I have also developed an interest in Arctic coastal geomorphology, so this discovery scratched a couple of itches for me.
One of the photos was taken above Alexandra Fjord on Ellesmere Island, which is insanely far north (78°N!):
Alexandra Fjord, Ellesmere Island. Photo copyright B.G. Pearson.
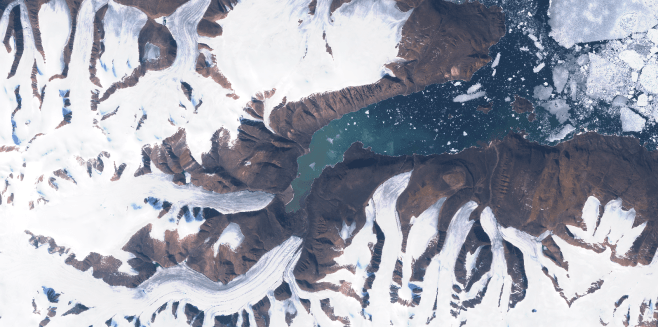
The cool thing is that when I went into Google Earth, I was able to snoop around and actually to find the same vantage point. To my surprise, it seems like the glaciers there haven’t changed much since my grandfather was there in 1957:
Alexandra Fjord today, seen in Google Earth.
However, Dad pointed out that perhaps the glacier at the front hasn’t changed, but that the ice field behind it has shrunk. He probably has a point there…
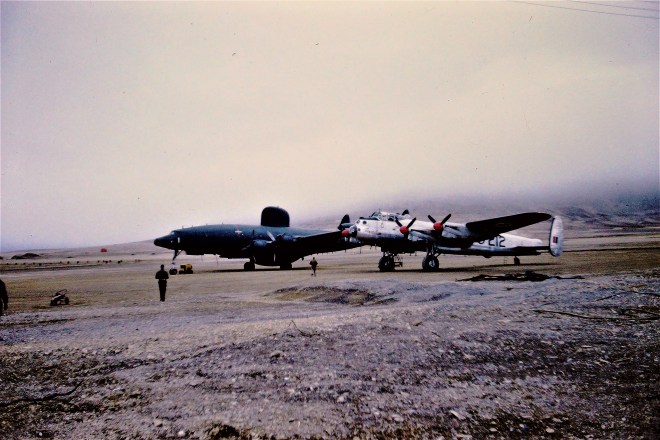
So pristine! Photo copyright B.G. Pearson.My Grandpa’s airplane on the right hand side. Photo copyright B.G. Pearson.
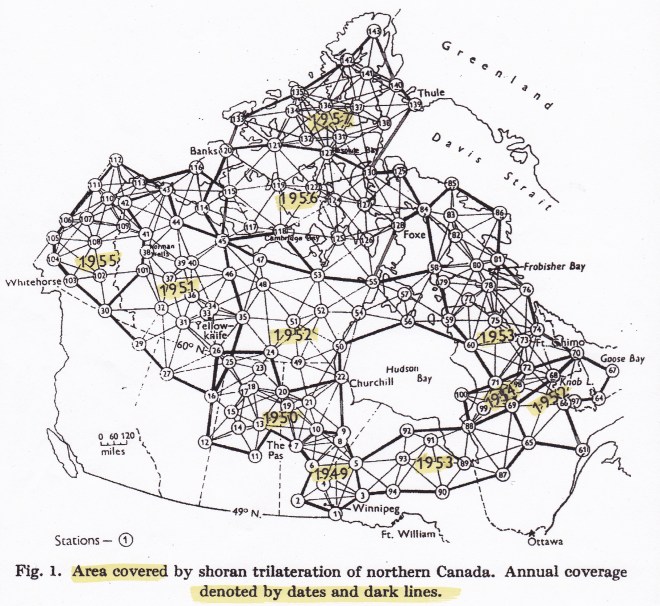
Why was he actually up there, and what were they surveying? A series of radar transponders were set up across northern Canada so that the airplanes could precisely triangulate their positions . Based out of Ottawa, my Grandpa and his colleagues carried out many long flights between remote destinations A newspaper article from 1957 describes the tremendous undertaking that mapping the entire Canadian Arctic was, apparently the world’s most ambitious aerial survey operation at the time:
“SEVEN-YEAR JOB: Rockcliffe Squadron to Complete Mapping
Monday, March 25, 1957
“Planes from the RCAF’s 408 Photo Squadron at Rockcliffe Airport will fly to within 450 miles of the North Pole this Spring to complete the geodetic survey of Canada which it started seven years ago.”
“Using the huge USAF base at Thule, Greenland, and RCAF’s own base at Resolute Bay, both well within the Arctic Circle, the planes will criss-cross approximately 400,000 square miles of Arctic wasteland to produce reference points for the accurate mapping of Canada.”
“This year’s aerial mapping mileage will bring over 3,000,000 square miles – approximately 90 percent – of Canadian territory accurately surveyed by the Air Force. When the 300 men of the squadron return to base here about July 1, they will have completed the world’s greatest aerial survey operation.”
Survey points in the Canadian Arctic from the 1950s. My Grandpa flew some of the northernmost missions.
While the mapping operation may have been motivated by a Cold War-era push to map Canada’s north for defense purposes, the operation was also of great scientific benefit. In addition to providing a wealth of useful data for glaciologists, the measurements also provided important insights into other fundamental geophysical questions. For instance, the earth is not a sphere, but rather an oblate spheroid, or something like a squashed rugby ball. But even then, gravity is weird and complicated, so the rugby ball comparison only takes you so far, and precise measurements are necessary to figure out all of the actual irregularities in Earth’s shape.
Measurements like these have many applications, including for estimating sea level rise rates. By understanding how the Canadian Arctic is rebounding in response to deglaciation, scientists can better answer Tricky Questions About Sea Level Rise there.
One of my favourite stories from the 1957 article involved some of the corrections that were made to previous maps:
“Throughout the … programme, many positions believed to be accurate were found to be in error. In 1956, for example, Prince of Wales Island (in which the North Magnetic Pole was then located) was found to be three miles further south than was indicated on the map.”
“Although they didn’t possess any supernatural strength to move mountains, from such discoveries as this, the members of the 408 Photographic Squadron did, facetiously, claim the ability to move islands.”
I would thus like to think that all my researchon islands is simply carrying on a Pearson family tradition! My Dad (a civil engineer) also worked in the Arctic during the 1980s, constructing artificial islands in the Beaufort Sea. That’s a story for another time, though!
Speaking of Pearson family traditions, I can see that my Grandpa also had a clear eye for photographic composition, a gift that my Dad quite strongly inherited:
Airship on some remote runway in the far Canadian north. Photo copyright B.G. Pearson.
Another reasons I was so delighted by these photos is because one of my favourite painters, Lawren Harris, also spent a lot of time in the Canadian Arctic. I have always felt drawn to his dramatic mountain landscapes capped with snow, and nary a tree for thousands of miles. The mountains of the far north have a particular shape to them, which seems unique compared to most of the mountains I have seen with my own eyes.
Mount Thule, Bylot Island, by Lawren Harris, one of my favourite painters. He had a very unique view of the same Arctic landscapes my Grandpa used to fly over.
I made it as far north as Lofoten in Norway (68°N), and have flown over parts of the Arctic on transatlantic summer flights, but have never actually set foot on those rugged and remote hills. Something for my bucket list!
One more of Alexandra Fjord from space, because I can’t get enough of the staggering beauty of these landscapes. [Source: Sentinel 2 L1C on July 17, 2019]
All hail the mighty squash!
Neglected by many
Loved by few
Such a noble vegetable!
There in abundance at my Albert Heijn
The lone survivor of panic-stricken shoppers
You stand defiantly on a shelf
With only wonky-looking peppers and carrots
To keep you company
But I see you, squash.
I recognize your beauty And your potential.
Together we will make
Wondrous pastas and curries
Soups, salads, and even pies
If my shitty toaster oven
Is feeling merciful
Greetings from Delft on Day 10 of quarantine! These are strange times indeed, on so many levels. I am fortunately still safe and healthy at home in Delft. Let’s all keep our hands washed and fingers crossed in the weeks to come, and STAY THE FRIG HOME! We’re all in this together.
I have in part been occupying myself with preparing online lectures for our Coastal Dynamics course. We are extremely fortunate in that most of the course was already available online due to preparations made in previous years, but the lectures I was meant to give this week on tidal inlets were not. I changed a bunch of things in the slides last year, so we had a number of student requests to record new lectures. We live in an era where online education was already becoming more and more the norm, and I think this crisis will just push that trend over the edge.
With that in mind, I decided to try my hand at narrating the slides using Kaltura, a program for doing video capture. There are a few different options out there, but that was the one that I liked best. I have actually been having a lot of fun with the lectures- it feels like I’m hosting a podcast or on the radio. “GOOOOOOOOOOOOOOOOOOOOOOOOOOOOOOD MORNING QUARANTINE!!!!!” I suspect it wouldn’t be the most popular podcast (there are not so many of us ebb-tidal delta enthusiasts), but hopefully I can convert a few of our students in the process.
On Friday I prepared a lecture on the evolution of barrier coasts, such as the Dutch coast or much of the Eastern and Gulf of Mexico coasts of the US. I couldn’t help but share a few interesting links with the students, and I thought I’d post them here too. This is a really cool animation showing 30 years of barrier island and tidal inlet evolution on the southeastern coast of Australia, obtained via satellite imagery:
Ending the week with some spectacular coastal geomorphology at Victoria’s Corner Inlet, captured using 30 years of @USGSLandsat data.🛰️
This area is cloudy and difficult to map using satellites – this animation using a rolling median to get a clean view over time #DigitalEarthAUpic.twitter.com/s0cB8lLvDr
— Dr Robbi Bishop-Taylor 🛰️ (@SatelliteSci) March 6, 2020
There’s also the iCoast tool developed by the US Geological Survey for training their machine learning algorithms to recognize storm damage to barrier islands from hurricanes. It shows you to see before and after photos, and asks you to tag the changes or damage that you see, which is a great way to learn more about coastal geomorphology. You’re also helping the USGS improve their detection algorithms- citizen science!: https://coastal.er.usgs.gov/icoast/
To keep myself sane/busy this weekend, I bought a linocut printing kit from the printing shop around the corner from my house (Indrukwekkend, which means “impressive” in Dutch- I love puns that work in more than one language!). I had always wanted to try it out, but never made time for it. No time like the present! I took one of my old sketches of waves (see here for the original inspiration) and made a print of it. By the end my desk was an unholy mess of ink, but I had a lot of fun and found the linoleum carving to be very therapeutic. See the top of the page for the finished product!
That’s all for now. Stay sane and healthy, readers! And be kind to one another.
What pathways does sediment take as it travels through an estuary? Yesterday, Laurie van Gijzen defended her thesis, entitled “Sediment Pathways and Connectivity in San Francisco South Bay“. Laurie is one of the master’s students that I supervise, and she has done a great job on this project.
San Francisco Bay is a massive estuary, with over six million people living nearby. In addition to San Francisco, Silicon Valley sits on its shores. Some of the biggest tech companies in the world like Google and Facebook have their head offices right next to the Bay. For over 150 years, the ecological health of the bay has deteriorated, in part due to land reclamations and contaminated sediment from gold mining. The dynamics of San Francisco thus have a huge economic, social, and environmental impact.
Laurie’s work focused on calibrating and improving a sediment transport model of the bay, in order to track the pathways of fine sediment (i.e., mud). She worked with a notoriously fickle model (DELWAQ) and succeeded in greatly improving its calibration.
Laurie’s thesis summarized into a single diagram (Figure 6.1 from her report). She shows the dominant sediment pathways as dark arrows, and the net accumulation (import, in orange) or depletion (export, in blue). Also indicated are the dominant physical processes responsible for sediment transport in the different parts of the bay. The baroclinic processes mentioned here are currents resulting from density differences in seawater due to changes in salinity and temperature.
Another cool thing about her work is that Laurie was the first person to apply the coastal sediment connectivity framework that I have been developing! She was able to use this to identify key transport pathways and critical locations in the bay. It was extremely helpful for my research, as it gives us a proof of concept that our framework is applicable to multiple sites and can tell us something useful.
Her work was also accepted for a presentation at the NCK Days conference, which was meant to be held this week in Den Helder, but was cancelled due to ongoing societal chaos. Great job, Laurie!
I recently found a poem by Raymond Carver that really struck a chord with me, and I thought I’d share it for anyone else who is estuarily enthusiastic:
Where Water Comes Together with Other Water
I love creeks and the music they make.
And rills, in glades and meadows, before
they have a chance to become creeks.
I may even love them best of all
for their secrecy. I almost forgot
to say something about the source!
Can anything be more wonderful than a spring? But the big streams have my heart too. And the places streams flow into rivers. The open mouths of rivers where they join the sea. The places where water comes together with other water. Those places stand out in my mind like holy places. But these coastal rivers! I love them the way some men love horses or glamorous women. I have a thing for this cold swift water. Just looking at it makes my blood run and my skin tingle. I could sit and watch these rivers for hours. Not one of them like any other.
I’m 45 years old today.
Would anyone believe it if I said
I was once 35?
My heart empty and serene at 35!
Five more years had to pass
before it began to flow again.
I’ll take all the time I please this afternoon
before leaving my place alongside this river.
It pleases me, loving rivers.
Loving them all the way back
to their source.
Loving everything that increases me
– Raymond Carver
The image at the top of this post is of the mouth of the Columbia River, apparently at the beginning of flood tide. The plume of sediment and fresh water from the muddy river has extended out into the Pacific and mixed with salty seawater. Then, as the tide turns, it floods and brings the new mixture back into the estuary. This results in the second, inner plume pushing its way past the jetties. The contrasting physical properties of these two meeting bodies of water results in the beautiful patterns we see here. “The places where water comes together with other water. Those places stand out in my mind like holy places.”
Sources:
Carver, R. Where Water Comes Together with Other Water. Astley, N. (Ed.). (2011). Being Human: Real Poems for Unreal Times. Tarset: Bloodaxe Books.
Sentinel-2 L1C image from February 10, 2020 (Source: https://tinyurl.com/uze5feu). Image has been slightly enhanced to improve contrast.
Today’s sand sample is from Clatsop Beach, Oregon, on the Pacific Northwest coast of the US. Last summer I spent several months modelling sediment transport at the mouth of the Columbia River with the US Geological survey, and had the great privilege of making a site visit at the end of my stay.
Working in partnership with Oregon State University and the Washington State Department of Ecology, I assisted with a topographic survey of the beaches surrounding the Columbia. Half the team surveyed the submerged parts of the beaches via jetski, and my group walked transects across the beach and up the dunes using backpack-mounted GPS units.
Starting at far-too-early-in-the-morning, our team split off individually, and I had an entire kilometers-long stretch of the beach to myself until almost lunch time, when we reconvened. I love long walks on the beach and take great pleasure in that sort of solitude in nature, and it was even cooler to do that while collecting data that could help the project I was working on. The digital computer model I had worked on all summer was now suddenly a real place where I could feel the sand between my toes.
Gold in Them Hills
The sand at this beach is interesting because of the black grains we see scattered throughout. This sediment is made of minerals like chromite, magnetite, and garnet, which are heavier than the whitish quartz grains we see around them. These deposits, known as “placers”, were transported to the sea from the mountains inland by the Columbia River. They form on the beach because lighter minerals like quartz are preferentially sifted out by waves and currents, leaving more of the dense particles behind. This even includes trace amounts of gold! Can you see any in the photograph below?
Sediment sample from Clatsop Beach, OR. Note the black “placer” deposits of heavy minerals. Can you see any flecks of gold?
At the end of our survey, I walked along the beach to check out a surprising object emerging from the sand: the wreck of the Peter Iredale, a sailing ship that ran aground there in 1906:
The Wreck of the Peter Iredale on Clatsop Beach.
Known as the “Graveyard of the Pacific“, the mouth of the Columbia is truly a “killer ebb-tidal delta”: huge waves and powerful currents meet violently, and have caused dozens of shipwrecks over the past few centuries. This makes effective management of the sediment there crucial for safe navigation, keeping the shipping channel dredged clear and disposing of the sediment in environmentally-friendly, cost-effective, and useful ways.
Historical shipwrecks at the Mouth of the Columbia River, seen in the Columbia River Maritime Museum.
Strategic placement of this dredged sediment was the focus of my time at USGS last summer, but I will delve into that more in a future post!
Vancouver holds a special place in my heart. I was born out there, and even though we moved away when I was very young, it has continued to re-emerge in my life. In 2011, I moved out there after a difficult breakup and the city breathed new life back into me. While there, I discovered a new vocation in hydraulic modelling for predicting floods, something that I am still doing to this day. I have returned to Vancouver a number of times since then, since my brother and a surprising number of my closest friends have ended up out there. I hope to return this September for a wedding!
Coal Harbour, Vancouver.
One of my favourite parts of Vancouver is walking its coastline. The city was built on the edge of a large fjord, but has a variety of coastal landscapes, from towering cliffs to sandy beaches, mud flats to salt marshes, and of course a number of urbanized shorelines.
Even though I am in the Netherlands now, I am trying to keep my Vancouver connection alive through my work. Last year, I co-supervised a fantastic group of TU Delft students who worked with Kerr Wood Leidal and the University of British Columbia (UBC) to investigate the erosion of the Point Grey cliffs, on which UBC is situated.
Eroding cliffs of Point Grey. The University of British Columbia is at the top of the cliff, so naturally they are concerned with understanding the rate of erosion and means of slowing it.
The project was an interesting one, as the students (representing three different countries) tried to bring their lessons learned about Dutch coastal engineering to Canada. Canadian coastal zone management is much more fragmented than in the Netherlands, where everything is more or less centrally controlled by the federal government. The entire Dutch coastline is also incredibly well-monitored, with high resolution bathymetry taken every few years, and with countless other measurements available. Acquiring the data necessary to perform a coastal engineering study in Vancouver required contacting dozens of different sources and dealing with numerous agencies at multiple levels of government.
Sand from Wreck Beach. It is quite coarse and angular in shape, and the green and red tints are quite nice. Being glacial in origin, these sand grains have likely been bulldozed by ice or carried by meltwater from far and wide. This accounts for the variety of particles we see.
In the end, the students looked at a number of possible solutions for slowing the coastal retreat, including sand nourishments and revetments. One of the most intriguing concepts that they explored was the idea of a clam garden, a traditional approach from the First Nations people living on the BC coastline. Originally intended for aquaculture, clam gardens are usually small rock walls placed along gravel beaches, behind which where clam-friendly sand or mud can accumulate. However, this approach could have added benefits for coastal protection by attenuating waves and encouraging the deposition of sediment. In many ways, it is not that different from the Dutch using brushwood dams to reclaim land in the Netherlands or my colleagues using similar structures to rebuild mangrove habitats.
In Canada, the involvement of First Nations in coastal planning is becoming increasingly important (as I think it should be!), and there is a lot that science and engineering can benefit from their traditional forms of knowledge and experience. Building with nature instead of fighting against it has recently become a popular design philosophy in coastal engineering, and who better to have as allies in that task than the people who have been living with and building with nature already for centuries?
World War II-era bunker on Wreck Beach overlooking the Georgia Strait, with North Vancouver in the background.
The Delft-Vancouver connection continues: right now we have a group of five students investigating coastal protection solutions with Kerr Wood Leidal and the Tsleil-Waututh Nation. They have already been out there for a month, and I am excited to see what they come up with!
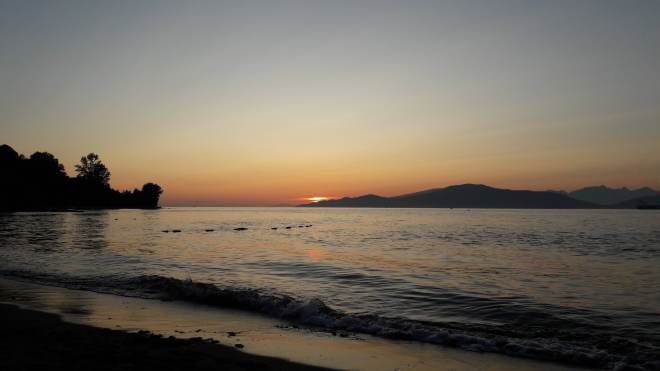
Sunset over the Spanish Banks, just around the corner from UBC.
Last week in our Coastal Dynamics course, we discussed the topic of sea level rise (SLR) and its impact on coastlines around the world. A rather perceptive student asked me about an assignment question about the subtleties of regional sea level rise:
Where in the world does the melting of the Antarctic Ice Sheet have the greatest impact?
This is a good question, because it shines a light on the complex reality of sea level rise: it is not the same everywhere. Local factors like isostatic adjustment and regional subsidence mean that certain locations can deviate significantly from the global average rate of sea level change.
Isostatic adjustment is the flexing of the earth’s crust as it rebounds from the heavy weight of ice sheets that once pressed down on it (much like the behaviour of your couch cushions after you stand up). This means that some formerly-glaciated areas like Northern Canada and Norway actually experience a local sea level fall, not a rise. Further away from those glaciated areas, you can have the opposite effect and experience increased sea level rise due to a sort of levering effect.
However, another important principle (and a mind-blowing one to me, when I first heard it), is that of gravitational attraction: ice sheets are so massive that they actually exert a gravitational pull on the oceans, pulling water levels up towards them. The flipside of this is that when those ice caps melt, the water near them redistributes to the other parts of the oceans further away. This leads to the remarkable notion that us in the northern hemisphere will suffer most from the melting of Antarctica, while our southern cousins will get their feet wet primarily from the deglaciation of Greenland and mountainous ice caps in the northern hemisphere.
Contribution to sea level rise from Greenland (top panel) and the West Antarctic Ice Sheet (bottom panel). In general, the further away from the ice sheet, the greater the increase in sea level (orange colours). Source: Milne, et al. (2009). Identifying the causes of sea-level change. Nature Geoscience, 2(7), 471-478.
There has recently been some interesting research on the idea of “fingerprinting” the impact of a particular glacier on sea level rise at a given location through exploratory modelling:
“The loss of mass changes Earth’s gravitational field causing the fresh meltwater and ocean water to move away towards faraway coastlines; the resulting pattern of sea-level rise is the fingerprint of melting from that particular ice sheet or glacier. For example, the latest study found that ice melt in Antarctica causes sea level to rise 52% faster in California and Florida than it does in other parts of the world, Velicogna says. Much of Earth’s middle and lower latitudes bear the brunt of rising sea levels because they’re sandwiched between Antarctica and Greenland, which are home to massive ice sheets that are shedding mass as meltwater or icebergs.” Source.
This article in the Guardian nicely illustrates the relevant concepts. See also here and here for more details. From these sources (and the references therein) we can see that the mechanisms contributing to sea level rise are highly location-dependent, and I barely skim the surface here. Although these questions of “which glacier is submerging my house?” are scientifically fascinating, it shines some light on just how complicated our planet’s climate system really is. It is scary to wonder about all of the future impacts like these that we can’t foresee or don’t yet understand…


