

A few weeks ago, I was reading a book about glaciology recently when a sentence caught my eye. Many advances in our understanding of how glaciers developed and transformed our world during the last ice age came from studying the Canadian landscape. In particular:
A benchmark example [of paleo ice sheet reconstruction] was the compilation of the first Glacial Map of Canada in 1959, followed by its update in 1968, by the Geological Survey of Canada, based on painstaking aerial photograph and field mapping by its officers on a map sheet by map sheet basis after the completion of the aerial photograph coverage for the whole country in the 1950s.
This caught my eye, because I knew that my Grandpa on my Dad’s side of the family was a pilot who flew a lot of aerial surveys for the Canadian government in the late 50s. I mentioned this to my Dad, just thinking he’d say, “gee, that’s cool”, and move on. Apparently that triggered something in him though, because a few days later my email inbox was filled with a treasure trove of old family photos that I had never seen before. In recent years I have also developed an interest in Arctic coastal geomorphology, so this discovery scratched a couple of itches for me.
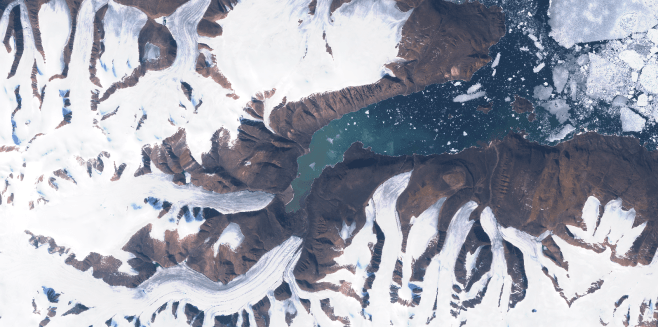
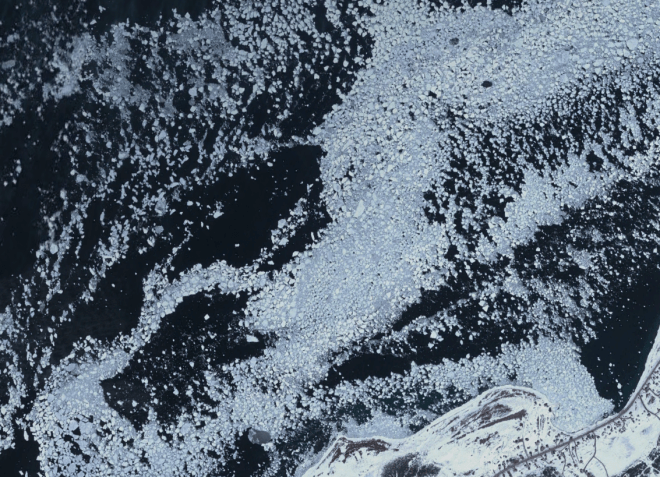
One of the photos was taken above Alexandra Fjord on Ellesmere Island, which is insanely far north (78°N!):

The cool thing is that when I went into Google Earth, I was able to snoop around and actually to find the same vantage point. To my surprise, it seems like the glaciers there haven’t changed much since my grandfather was there in 1957:

However, Dad pointed out that perhaps the glacier at the front hasn’t changed, but that the ice field behind it has shrunk. He probably has a point there…

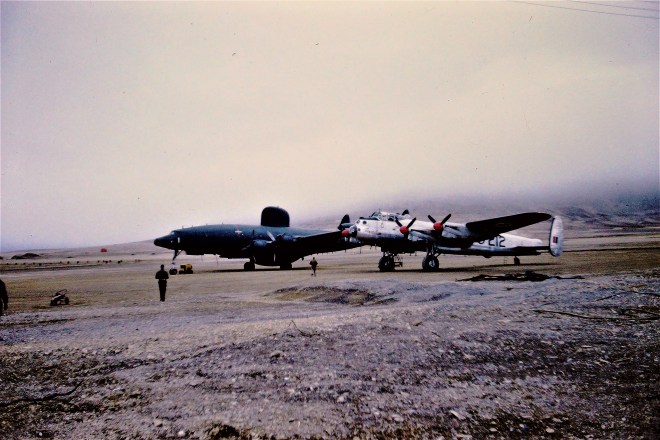
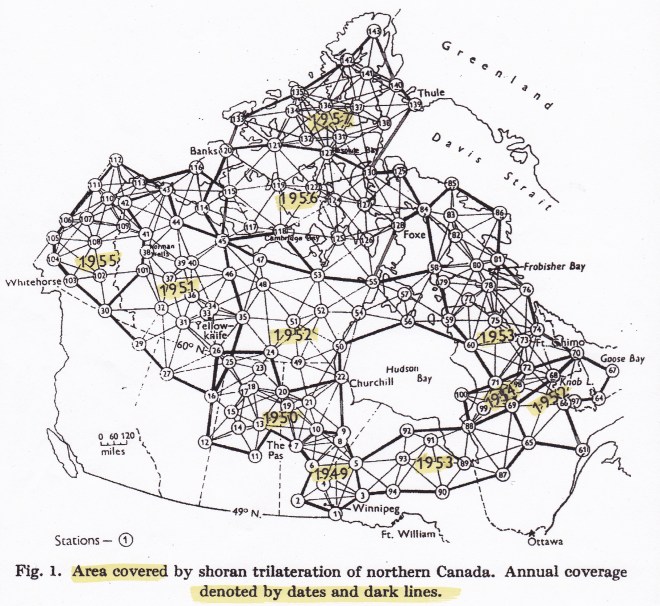
Why was he actually up there, and what were they surveying? A series of radar transponders were set up across northern Canada so that the airplanes could precisely triangulate their positions . Based out of Ottawa, my Grandpa and his colleagues carried out many long flights between remote destinations A newspaper article from 1957 describes the tremendous undertaking that mapping the entire Canadian Arctic was, apparently the world’s most ambitious aerial survey operation at the time:
“SEVEN-YEAR JOB: Rockcliffe Squadron to Complete Mapping
Monday, March 25, 1957“Planes from the RCAF’s 408 Photo Squadron at Rockcliffe Airport will fly to within 450 miles of the North Pole this Spring to complete the geodetic survey of Canada which it started seven years ago.”
“Using the huge USAF base at Thule, Greenland, and RCAF’s own base at Resolute Bay, both well within the Arctic Circle, the planes will criss-cross approximately 400,000 square miles of Arctic wasteland to produce reference points for the accurate mapping of Canada.”
“This year’s aerial mapping mileage will bring over 3,000,000 square miles – approximately 90 percent – of Canadian territory accurately surveyed by the Air Force. When the 300 men of the squadron return to base here about July 1, they will have completed the world’s greatest aerial survey operation.”
While the mapping operation may have been motivated by a Cold War-era push to map Canada’s north for defense purposes, the operation was also of great scientific benefit. In addition to providing a wealth of useful data for glaciologists, the measurements also provided important insights into other fundamental geophysical questions. For instance, the earth is not a sphere, but rather an oblate spheroid, or something like a squashed rugby ball. But even then, gravity is weird and complicated, so the rugby ball comparison only takes you so far, and precise measurements are necessary to figure out all of the actual irregularities in Earth’s shape.
Measurements like these have many applications, including for estimating sea level rise rates. By understanding how the Canadian Arctic is rebounding in response to deglaciation, scientists can better answer Tricky Questions About Sea Level Rise there.
One of my favourite stories from the 1957 article involved some of the corrections that were made to previous maps:
“Throughout the … programme, many positions believed to be accurate were found to be in error. In 1956, for example, Prince of Wales Island (in which the North Magnetic Pole was then located) was found to be three miles further south than was indicated on the map.”
“Although they didn’t possess any supernatural strength to move mountains, from such discoveries as this, the members of the 408 Photographic Squadron did, facetiously, claim the ability to move islands.”
I would thus like to think that all my research on islands is simply carrying on a Pearson family tradition! My Dad (a civil engineer) also worked in the Arctic during the 1980s, constructing artificial islands in the Beaufort Sea. That’s a story for another time, though!
Speaking of Pearson family traditions, I can see that my Grandpa also had a clear eye for photographic composition, a gift that my Dad quite strongly inherited:

Another reasons I was so delighted by these photos is because one of my favourite painters, Lawren Harris, also spent a lot of time in the Canadian Arctic. I have always felt drawn to his dramatic mountain landscapes capped with snow, and nary a tree for thousands of miles. The mountains of the far north have a particular shape to them, which seems unique compared to most of the mountains I have seen with my own eyes.

I made it as far north as Lofoten in Norway (68°N), and have flown over parts of the Arctic on transatlantic summer flights, but have never actually set foot on those rugged and remote hills. Something for my bucket list!


