Ebb-tidal deltas: Badass Morphological Features (BAMFs)

At TU Delft, a requirement for our PhD defense is to make ten propositions based on what we have learned during the previous years. Claims posed by my friends and colleagues deal with the nitty gritty details (“All diffusive processes can be derived from an advective one, and failing to do so yields incorrect modelling[1]) but also the bigger picture of how we do what we do (“The way morphological models are presented and interpreted has a lot in common with predictions of snow depth in five years on December 26th at 4pm. The knowledge in these models deserves a better presentation[2]).

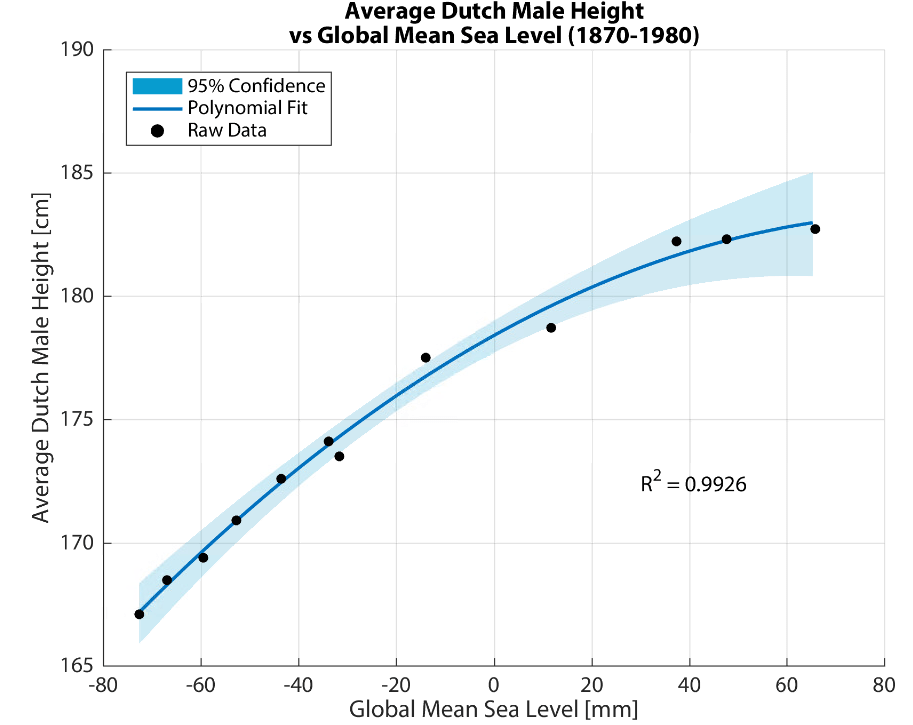
The propositions must be both defendable and opposable, so as to stimulate an interesting debate during the defense. Some of the propositions should reflect the findings of our research, but it is also traditional to include statements that have nothing to do with it. One colleague[3] even suggested (tongue in cheek) that the increase in the height of Dutch men over time could be explained by sea level rise. I couldn’t resist analyzing the data myself, and the results were surprisingly good:

Spurious correlation of the week! As John von Neumann said, “With four parameters I can fit an elephant, and with five I can make him wiggle his trunk.”

These propositions are a chance to inject a bit of last-minute philosophizing into our Doctorates of Philosophy, and range from the wise (“No wind is favourable if a person does not know to what port (s)he is steering – Seneca[4]) to the downright cheeky (“This proposition is not opposable[1]).

What I Learned by Counting Sand for 5 Years

As the clock is ticking on my own PhD (259 days, 13 hours, 39 minutes, and 51 seconds, but who’s counting? *eye twitches*), I started preparing some propositions of my own (obviously in a fit of procrastination on my dissertation). After nearly five years of scrutinizing sand and contemplating connectivity, my research has led me to an inescapable conclusion:

Ebb-tidal deltas are badass morphological features (BAMFs),
(c.f. Phillips [2015]).


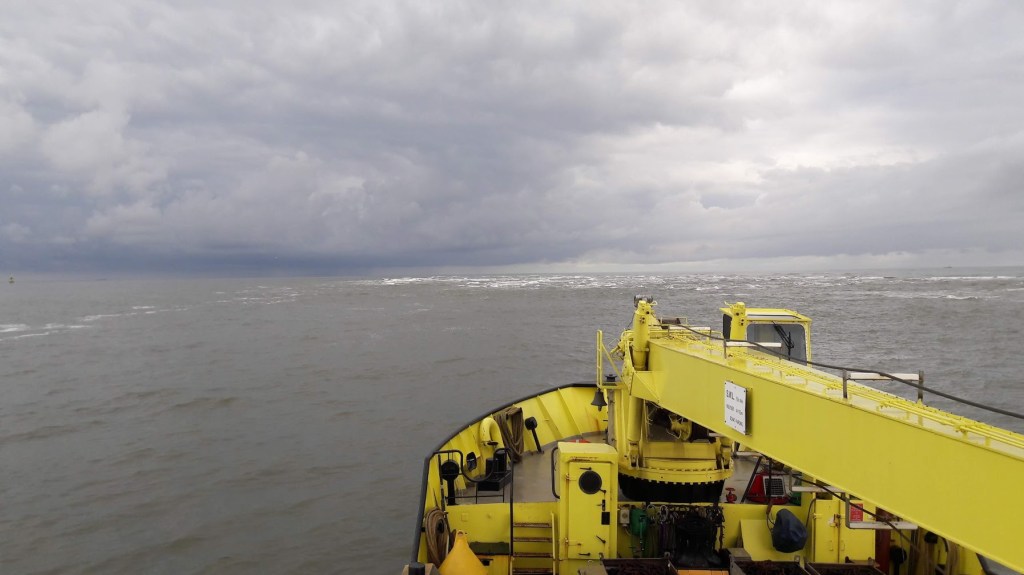
What, pray tell, is an ebb-tidal delta, and why is it so badass? Ebb-tidal deltas are large underwater piles of sand at the mouth of estuaries and tidal inlets, deposited by outflowing tides and reshaped by waves. I spend my days studying how waves and tides move sand around on the Ameland ebb-tidal delta in the northern part of the Netherlands (see below). We need to know this in order to plan ecologically-sustainable flood protection measures for the Dutch coast. A morphological feature is just a fancy name for some part of a landscape, like a hill or a valley or a beach.

An ebb-tidal delta is the giant pile of sand located at the mouth of a tidal inlet like this one. This may not sound glamorous, but understanding the way it moves around is extremely important for ensuring safe navigation and for predicting erosion and flooding of adjacent coasts.

What makes a badass “badass”?

Phillips[5] defines the archetypal badass as “individualistic, non-conformist, and able to produce disproportionate results”, and applies this concept to geomorphology (the study of how landscapes evolve, at the crossroads of geology and physical geography). Ebb-tidal deltas meet these three criteria, which makes them badass morphological features (BAMFs):

  1. Ebb-tidal deltas are each unique (in shape, location, composition, and in terms of the environmental forces shaping them (like waves and tides)), and hence individualistic.
  2. Ebb-tidal deltas are chaotic systems which defy accurate prediction using physics-based numerical models[6], and hence are non-conformist or “naughty”[7]. This numerical naughtiness is a serious problem for coastal engineers and scientists, since a failure to accurately predict ebb-tidal delta evolution can threaten public safety and lead to costly property or infrastructure damage. They do not “play by the rules” of our existing physics-based deterministic models. 
  3. Ebb-tidal deltas are highly nonlinear systems which can greatly amplify small instabilities[8], and hence produce disproportionate results.

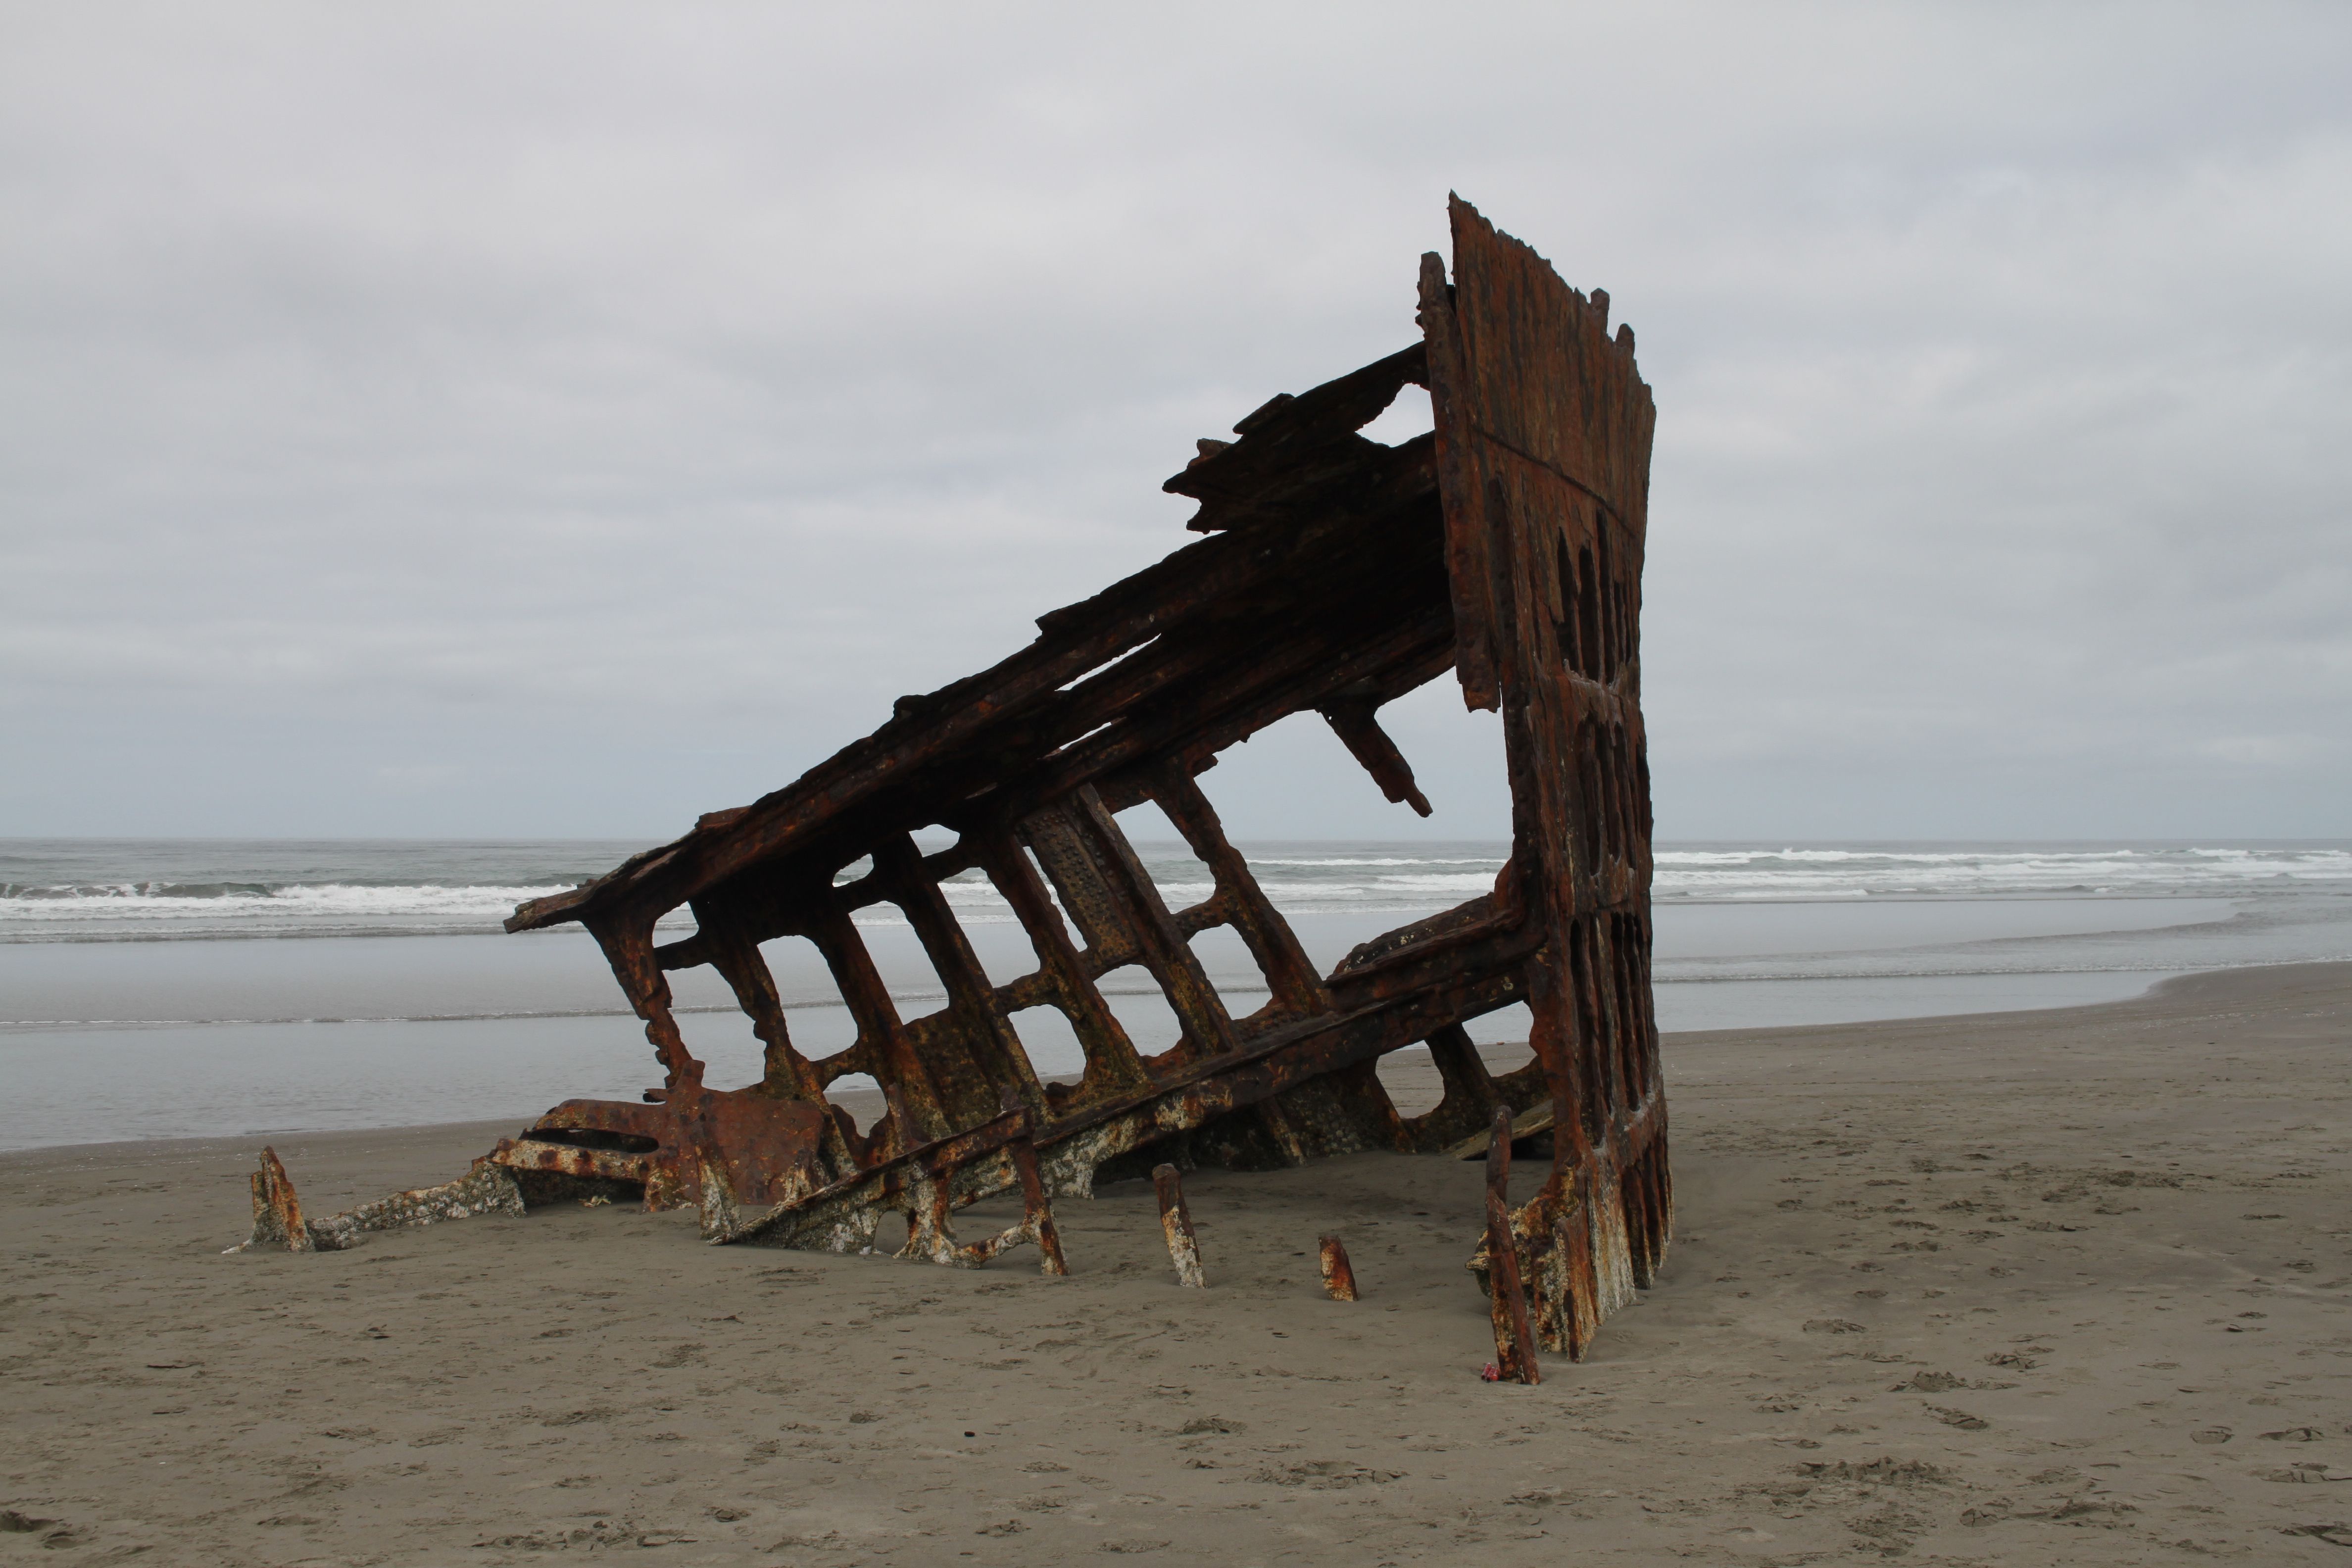
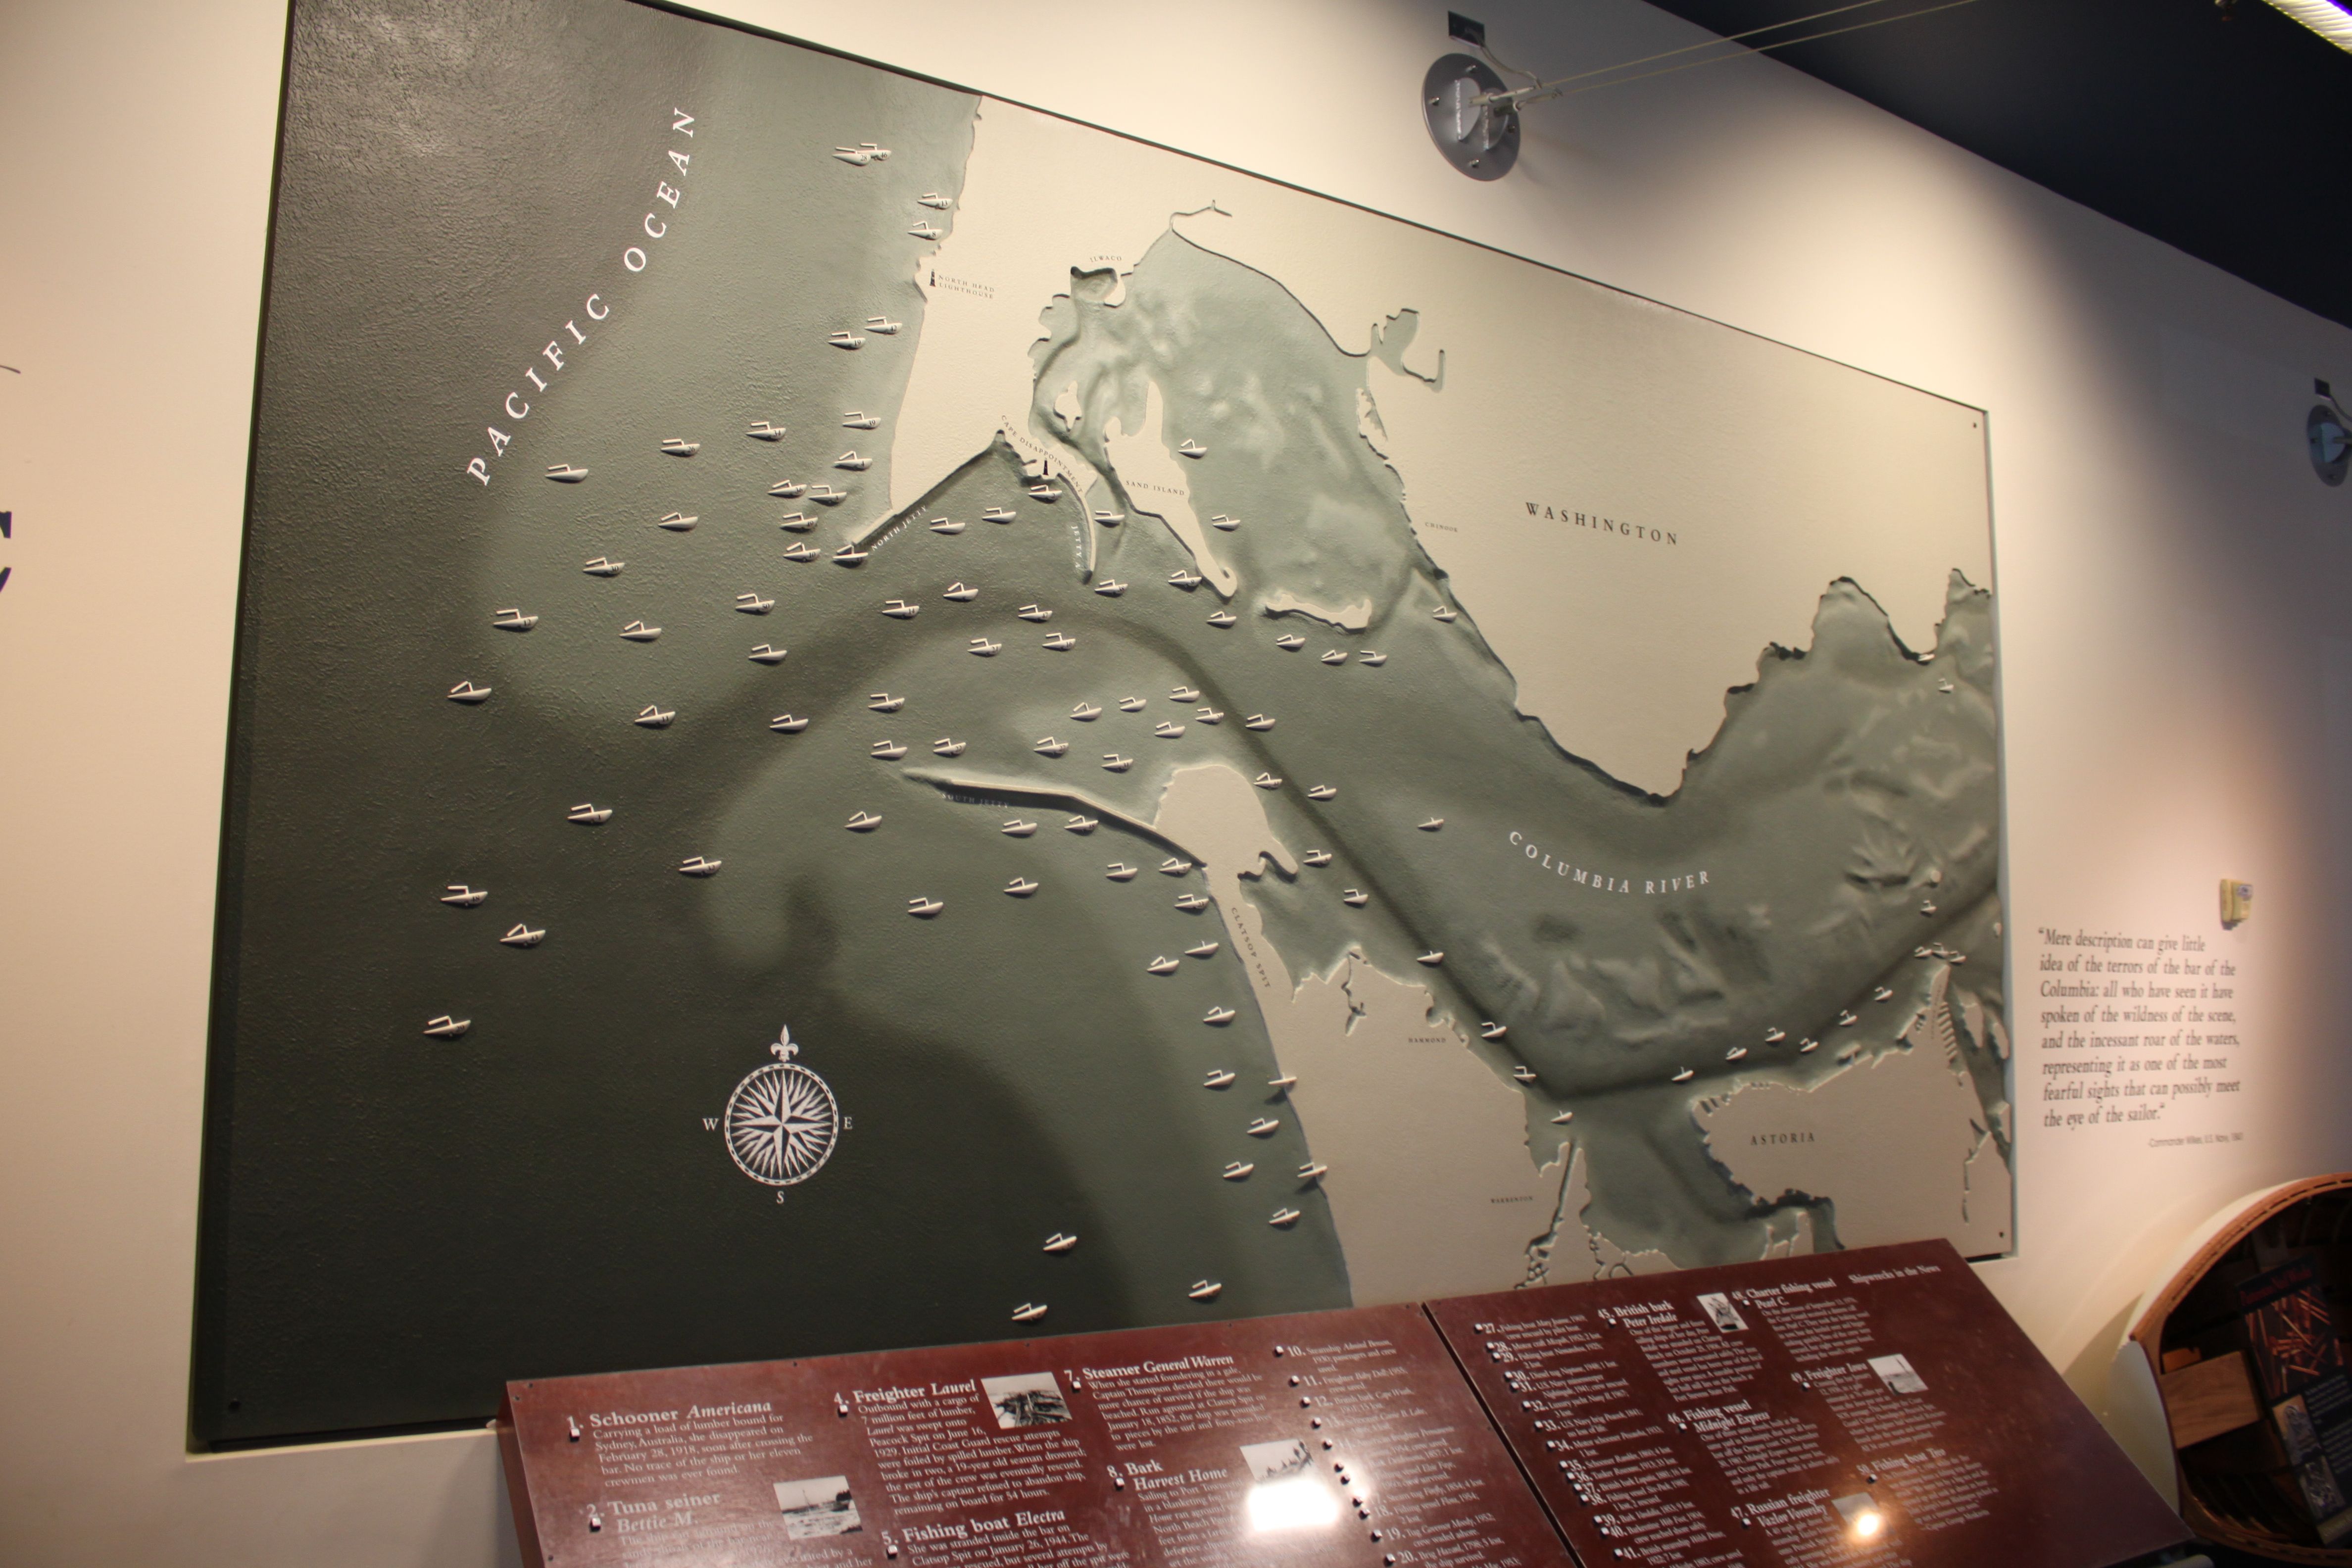
In addition to the strict definitions of Phillips[5], ebb-tidal deltas are also “belligerent or intimidating, ruthless, and tough”, other traits reflective of badassery [Oxford Engish Dictionary]. The Columbia River ebb-tidal delta alone is responsible for dozens shipwrecks in the past century, and Ameland ebb-tidal delta has also featured numerous wrecks throughout its history.

Quoting Thomas Pynchon[9], Phillips also notes that badasses are “able to work mischief on a large scale”. Ameland ebb-tidal delta covers an area of approximately 100 square kilometers, roughly the size of The Hague. Many ebb-tidal deltas around the world are even larger!

Seriously?

Now admittedly, ebb-tidal deltas are just big piles of sand. A big pile of sand is probably not the first thing that comes to mind when you hear the word “badass”, unless you are Ralph Bagnold or a Sarlacc. This could probably also be considered gratuitous personification or anthropomorphization.

I’m sure that many of my friends and family have been scratching their heads as to why I would sacrifice the latter half of my 20s to understand them better. A critical reader might ask, “is it possible that you have only convinced yourself that ebb-tidal deltas are cool out of self-preservation?” And the answer is yes. Yes, I have. Nonetheless, I remain steadfast in my assertion that ebb-tidal deltas exhibit major symptoms of geomorphological badassery.

Although the concept of geomorphological badassery may seem silly at first, it illuminates several important truths of our (mis)understanding of these complex bathymetric features. Ebb-tidal deltas are important to study for reasons of coastal flood protection, navigational safety, and ecological value, but we are bad at predicting how they will evolve. This is because each ebb-tidal delta is unique, making it challenging to generalize their behavior.  Furthermore, their chaotic, non-conformist behavior renders many of our usual deterministic prediction techniques ineffective.  Lastly, the amplifying effect of highly nonlinear physical processes means that small physical changes (e.g., the development of a tiny shoal) could have disproportionately large consequences (e.g., relocation of a channel several kilometers wide).  As such, badassery provides a useful conceptual framework for describing the challenges presented by ebb-tidal deltas to coastal engineers and scientists. 

Badass.

References

[1] Chavarrias Borras, V. [2019]. Obtaining well-posedness in mathematical modelling of fluvial morphodynamics. PhD Thesis, Delft University of Technology.
[2] de Schipper, M.A. [2014]. Alongshore variability of nourished and natural beaches. PhD Dissertation, Delft University of Technology.
[3] Meirelles Nunes da Rocha, S. Effects of a stratified tidal flow on the morphodynamics. PhD Dissertation, Delft University of Technology.
[4] de Vet, P.L.M. [2020]. Intertidal Flats in Engineered Estuaries: On the Hydrodynamics, Morphodynamics, and Implications for Ecology and System Management. PhD Dissertation, Delft University of Technology.
[5] Phillips, J. D. (2015). Badass geomorphologyEarth Surface Processes and Landforms40(1), 22-33. (Yes, this is a legitimate scientific publication!)
[6] Elias, E., Teske, R., van der Spek, A., & Lazar, M. [2015]. Modelling tidal-inlet morphodynamics on medium time scales. In The Proceedings of the Coastal Sediments 2015.
[7] Kennedy, B. A. [1979]. A naughty world. Transactions of the Institute of British Geographers, 550-558.
[8] Elias, E. P., Van der Spek, A. J., Pearson, S. G., & Cleveringa, J. [2019]. Understanding sediment bypassing processes through analysis of high-frequency observations of Ameland Inlet, the Netherlands. Marine Geology, 415, 105956.
[9] Pynchon T. [1984]. Is it O.K. to be a Luddite? The New York Times Book Review (October 28): 40–41.

Ameland Datapalooza!

Check out our new paper here!

Three years ago, I experienced one of the highlights of my professional career so far. Alongside researchers from 3 universities, the Dutch government, and several other institutions, we carried out a 40-day field measurement campaign at Ameland Inlet in the north of the Netherlands. We deployed several frames loaded up like Christmas trees with every instrument imaginable: ADVs and ADCPs to measure waves and currents, LISSTs and OBSs to measure suspended sediment, a YSI multiprobe to measure salinity and other water quality indicators, and even a 3D sonar to track the migration of ripples along the seabed.

One of the five measurement frames that we deployed in Ameland back in Fall 2017. It was stacked full of instruments to measure the waves, currents, suspended sand and mud, salinity, ripples, and more.

Four of our five frames survived the relentless ebb and flow of the tide, and even two major storms (one of which left me stranded in Germany after the wind blew down all the overhead train power lines between Berlin and Amsterdam!). In the end, we obtained enough data to keep me busy for probably 3 PhDs, if not the rest of my career. This is just as well, since that last frame was buried in the storm, and based on our understanding of the local dynamics, it will likely re-emerge in another few decades, just in time for my retirement! I look forward to sharing my other findings with you here in the next few months!

Although it used to be the norm for scientists to squirrel away their data, there is an increasing movement towards open accessibility of research data. This improves transparency and accountability in the scientific process, and opens up new opportunities for collaboration. The data we collected is now available in its entirety here on the 4TU web portal or on Rijkswaterstaat’s interactive web viewer.

However, there is a lot of data – I mean A LOT! To help researchers interpret the contents of this database, we prepared an overview paper, which was finally published in the journal of Earth System Science Data! It is also accompanied by a more detailed report, which gets into the nitty-gritty details we didn’t have room to describe in the paper. Nobody likes to read a phonebook-sized report, but it’s nice to have the information there for the few brave souls who do want to comb through our dataset.

Sailing across the Vlie ebb-tidal delta on our way to retrieve the measurement frames at the end of the field campaign.

It was all a huge team effort, as evidenced by the 20+ co-authors. My contribution to this paper focused on the processing of the LISST and YSI multiprobe data, which tell us about the size of particles floating through the water, and how salty that water is. I also designed the maps. As a kid, I loved to read and draw maps, and I think that 7-year-old Stuart would have been tickled to know that he would still be dabbling in cartography all these years later.

As the research in the rest of my PhD (and beyond!) will continue to focus on the fruits of this measurement campaign, I am very keen to work together and collaborate with other researchers who have an interest in this dataset. Please get in touch if you are interested!

Rolling the Dice: Dealing with Uncertainty in Coastal Flood Predictions for Small Island Developing States

Small island developing states around the world are especially vulnerable to the hazards posed by sea level rise and climate change. As engineers, we have a number of tools in our toolbox for reducing the risk posed by coastal flooding and for planning adaptation measures. We often rely on predictive models which combine information about expected wave and sea level conditions, the topography of the coast, and vulnerable buildings and population to estimate potential flooding and expected damage.

However, to use these types of models, we first need to answer a lot of questions: what exactly are the expected wave and sea level conditions? What if detailed topographic measurements are unavailable? What if the population of a given coastal area increases? How are the local buildings constructed, and what are the consequences of that for estimating damage from flooding?

If our information is imperfect (which it almost always is), all is not lost: we can still make educated guesses or test the sensitivity of our models to a range of values. However, these uncertainties can multiply out of control rather quickly, so we need to be able to quantify them. There is no sense in spending the time to develop a detailed hydrodynamic model if your bathymetry data is crap. Can we get a better handle on which variables are the most important to quantify properly? Can we prioritize which data is the most important to collect? This would help us make better predictions, and to make better use of scarce resources (data collection is expensive, especially on remote islands!).

Matteo Parodi investigated these questions in his master’s thesis, and just published his first paper, “Uncertainties in coastal flood risk assessments in small island developing states“. I had the great privilege and joy of co-supervising Matteo during his thesis, and I am immensely proud of him and his work!

Based on a study of the islands of São Tomé and Príncipe, off the coast of Africa, Matteo found that topographic measurements and the relationship between flood depth and damage to buildings were the biggest uncertainties for predicting present-day flood damage. This means that measuring topography of vulnerable coastal areas in high resolution, and performing better post-disaster damage surveys will provide the best “bang for your buck” right now. However, for longer time horizons (i.e. the year 2100), uncertainty in sea level rise estimates become most important.

Matteo’s work will help coastal managers on vulnerable islands to better prioritize limited financial resources, and will improve the trustworthiness of our predictive models. Great job, Matteo!

Can 3D-Printed Corals Help Us Prevent Flooding?

Coral reefs around the world are dying; that much is clear from the headlines we see in the news that grow increasingly distressed with each passing year. This is an ecological catastrophe, but are we also losing another key benefit of reefs? Coral reefs provide a form of natural protection against wave-driven flooding on tropical coastlines. This is partly because the physical form of the reef (often a big rocky shelf) serves as a sort of natural breakwater, but is also due to the frictional effects of the corals themselves.

Many species of coral have complex shapes that disrupt the flow of water across reefs, generating turbulence and dissipating energy. This has the effect of reducing the height of waves as they travel across the reef towards the shore. However, these effects are incredibly complex and poorly understood, so we usually just simplify them in our predictive models by considering a reef to be more “hydraulically rough” than a sandy beach, for example. But we need to do better: these models are used to forecast flooding and estimate the impact of future climate change on vulnerable coasts.

How can we improve this? In coastal engineering, we often conduct experiments in the laboratory to test our theories and understand the chaos of natural systems in more controlled settings. What if we could make a scale model of a coral reef and measure exactly how waves are dissipated?

I am extremely proud to announce the graduation of Paul van Wiechen, one of the Master’s students whom I have had the pleasure of supervising. Yesterday, he defended his thesis, “Wave dissipation on a complex coral reef: An experimental study“, where he built a tiny coral reef in the TU Delft wave flume (a 30-m long bathtub with a wave-making paddle at one end) using hundreds of 3D-printed coral models.

Paul’s thesis, “Wave dissipation on a complex coral reef: An experimental study“.

It was one of the coolest projects I have ever seen, and his research provides us with valuable measurements that give us a deeper understanding of the vital role that corals play in protecting our coasts.

He also did all of this in the middle of a global pandemic, and somehow managed to stay completely on schedule. We are very lucky, because Paul will be joining the Coastal Engineering department here at TU Delft to start a PhD on dune erosion this fall. We are all glad to have him on the team and eager to see what his research unveils next!

Clustering Coral Reefs for Coastal Flood Forecasting

Many of the world’s idyllic tropical coasts are facing threats on multiple fronts.  Rising seas threaten the very habitability of many low-lying islands, and the coral reefs that often defend these coasts from wave attack are dying, too.  Compounding this problem is the sheer number and variety of these islands: there are thousands of islands, and the coral reefs surrounding them come in all shapes and sizes.  Located around the globe, these islands are each exposed to a unique wave climate and range of sea level conditions. This variability in reef characteristics and hydrodynamic forcing makes it a big challenge to forecast how waves will respond when they approach the shore, something that is quite tricky even at the best of times.  Under these circumstances, how can we protect vulnerable coastal communities on coral reef coasts from wave-driven flooding?

This is the problem that our fantastic former student, Fred Scott (now at Baird & Associates in Canada), tackled in his paper, Hydro-Morphological Characterization of Coral Reefs for Wave Runup Prediction, recently published in Frontiers in Marine Science.  Working in partnership with Deltares and the US Geological Survey for his master’s thesis, Fred came up with a new methodology for forecasting how waves transform in response to variations in the shape and size of coral reefs.

fredFigure1
(A) This is a typical fringing coral reef cross-section, showing waves approaching from the right, with the shore on the left. (B) Fred came up with a number of algorithms for classifying and organizing the massive dataset of coral reef cross-sections. (C) The measurements used in our study are from sites around the globe. (D) This is what 30,000 reef cross-sections look like when you try to plot them all on top of one another- clearly we need to whittle those down a bit… [Source: Scott et al, 2020]
In our previous research on this topic, we tried to predict flooding on coral reef-lined coasts using a very simplified coral reef shape.  This was fine as a first guess, but most reefs are bumpy and jagged and bear little resemblance to the unnaturally straight lines in my model. We couldn’t help it though: there just wasn’t enough data available when I started my thesis four years ago, so we did the best we could with the information we had at the time. On the bright side, using a single simple reef shape meant that we could easily run our computer simulations hundreds of thousands of times to represent a wide range of wave and relative sea level conditions.

Fast forward three years to when Fred began his own thesis. We now had access to a mind-boggling dataset of over 30,000 measured coral reef cross-sections from locations around the world!  However, instead of too little data, we now had too much!  If we wanted to simulate a whole range of wave and sea level conditions on each of the reefs in our dataset, it might take months or even years to run our models! Fred had the daunting task of distilling that gargantuan database down to a more manageable number of reef cross-sections.

But how do we choose which cross-sections are the most useful or important to look at?  Even though every coral reef is, like a beautiful snowflake, utterly unique, surely there must be some general trends or similarities that we can identify, right?  This question lies at the heart of Fred’s research, and to answer it, he turned to many of the same powerful statistical and machine-learning techniques used by the likes of Google and Facebook to harvest your life’s secrets from the internet or power self-driving cars.  Maybe we can use some of this technology for good, after all!

The main approach that Fred used in this study was cluster analysis, a family of techniques that look for similarities or differences between entries in a dataset, and then group the entries accordingly into clusters.  The entries within one cluster should be more similar to each other than to the entries in other clusters.  In our case, this meant grouping the reefs into clusters by similar shape and size. This allowed us to increase efficiency and reduce redundancy by proceeding with 500 representative cross sections, instead of the entire database of 30,000.

zoom
These days when I’m lonely, I Zoom with 500 of my favourite coral reef profiles…

Other studies in our field have tried similar approaches (such as this Brazilian study of coral reef shape), but the innovative part of Fred’s technique was to also account for similarities in the hydrodynamic response of the waves to each reef via a second round of clustering. Wave transformation on coral reefs can be immensely complicated, so it is entirely possible that two reef profiles could look very different, but lead to the same amount of flooding in the end.  Since we are mainly concerned about the flooding (rather than a classification for ecological or geological purposes about coral reef formation and evolution), this suits us just fine!

In the end, Fred was able to distill this colossal dataset into between 50-312 representative cross sections that can forecast wave runup with a mean error of only about 10%, compared to predictions made using the actual cross sections.  This opens the door wide for a range of future applications, such as climate change impact assessments or coral reef restoration projects.  Right now, we are working on a new project that will apply Fred’s approach to the development of a simplified global early-warning system for wave-induced flooding on coral reef-fronted coasts.

Great work, Fred, and congratulations on your first publication! I am excited to see where this road takes us!

Sources:

  1. Scott, F., Antolinez, J.A.A., McCall, R.C., Storlazzi, C.D., Reniers, A.J.H.M., & Pearson, S.G. (2020). Hydro-morphological characterization of coral reefs for wave-runup prediction. Frontiers in Marine Science. [Link]
  2. Scott, F. (2019). Data reduction techniques of coral reef morphology and hydrodynamics for use in wave runup prediction. [Link]. TU Delft MSc thesis in cooperation with Deltares and the US Geological Survey.
  3. Scott, F., Antolinez, J.A., McCall, R.T., Storlazzi, C.D., Reniers, A., and Pearson, S., 2020, Coral reef profiles for wave-runup prediction: U.S. Geological Survey data release [Link].

Fjords of the High Arctic

A few weeks ago, I was reading a book about glaciology recently when a sentence caught my eye.  Many advances in our understanding of how glaciers developed and transformed our world during the last ice age came from studying the Canadian landscape.  In particular:

A benchmark example [of paleo ice sheet reconstruction] was the compilation of the first Glacial Map of Canada in 1959, followed by its update in 1968, by the Geological Survey of Canada, based on painstaking aerial photograph and field mapping by its officers on a map sheet by map sheet basis after the completion of the aerial photograph coverage for the whole country in the 1950s.

This caught my eye, because I knew that my Grandpa on my Dad’s side of the family was a pilot who flew a lot of aerial surveys for the Canadian government in the late 50s.  I mentioned this to my Dad, just thinking he’d say, “gee, that’s cool”, and move on.  Apparently that triggered something in him though, because a few days later my email inbox was filled with a treasure trove of old family photos that I had never seen before.  In recent years I have also developed an interest in Arctic coastal geomorphology, so this discovery scratched a couple of itches for me.

One of the photos was taken above Alexandra Fjord on Ellesmere Island, which is insanely far north (78°N!):

Wolverine CAMERA
Alexandra Fjord, Ellesmere Island.  Photo copyright B.G. Pearson.

The cool thing is that when I went into Google Earth, I was able to snoop around and actually to find the same vantage point.  To my surprise, it seems like the glaciers there haven’t changed much since my grandfather was there in 1957:

googleEarth
Alexandra Fjord today, seen in Google Earth.

However, Dad pointed out that perhaps the glacier at the front hasn’t changed, but that the ice field behind it has shrunk.  He probably has a point there…

Wolverine CAMERA
So pristine!  Photo copyright B.G. Pearson.

Wolverine CAMERA
My Grandpa’s airplane on the right hand side.  Photo copyright B.G. Pearson.

Why was he actually up there, and what were they surveying?  A series of radar transponders were set up across northern Canada so that the airplanes could precisely triangulate their positions .  Based out of Ottawa, my Grandpa and his colleagues carried out many long flights between remote destinations A newspaper article from 1957 describes the tremendous undertaking that mapping the entire Canadian Arctic was, apparently the world’s most ambitious aerial survey operation at the time:

SEVEN-YEAR JOB: Rockcliffe Squadron to Complete Mapping
Monday, March 25, 1957

“Planes from the RCAF’s 408 Photo Squadron at Rockcliffe Airport will fly to within 450 miles of the North Pole this Spring to complete the geodetic survey of Canada which it started seven years ago.”

“Using the huge USAF base at Thule, Greenland, and RCAF’s own base at Resolute Bay, both well within the Arctic Circle, the planes will criss-cross approximately 400,000 square miles of Arctic wasteland to produce reference points for the accurate mapping of Canada.”

“This year’s aerial mapping mileage will bring over 3,000,000 square miles – approximately 90 percent – of Canadian territory accurately surveyed by the Air Force. When the 300 men of the squadron return to base here about July 1, they will have completed the world’s greatest aerial survey operation.”

SHORAN.-Schematic-by-Year
Survey points in the Canadian Arctic from the 1950s.  My Grandpa flew some of the northernmost missions.

While the mapping operation may have been motivated by a Cold War-era push to map Canada’s north for defense purposes, the operation was also of great scientific benefit.  In addition to providing a wealth of useful data for glaciologists, the measurements also provided important insights into other fundamental geophysical questions.  For instance, the earth is not a sphere, but rather an oblate spheroid, or something like a squashed rugby ball.  But even then, gravity is weird and complicated, so the rugby ball comparison only takes you so far, and precise measurements are necessary to figure out all of the actual irregularities in Earth’s shape.

Measurements like these have many applications, including for estimating sea level rise rates.  By understanding how the Canadian Arctic is rebounding in response to deglaciation, scientists can better answer Tricky Questions About Sea Level Rise there.

One of my favourite stories from the 1957 article involved some of the corrections that were made to previous maps:

“Throughout the … programme, many positions believed to be accurate were found to be in error. In 1956, for example, Prince of Wales Island (in which the North Magnetic Pole was then located) was found to be three miles further south than was indicated on the map.”

“Although they didn’t possess any supernatural strength to move mountains, from such discoveries as this, the members of the 408 Photographic Squadron did, facetiously, claim the ability to move islands.”

I would thus like to think that all my research on islands is simply carrying on a Pearson family tradition!  My Dad (a civil engineer) also worked in the Arctic during the 1980s, constructing artificial islands in the Beaufort Sea.  That’s a story for another time, though!

Speaking of Pearson family traditions, I can see that my Grandpa also had a clear eye for photographic composition, a gift that my Dad quite strongly inherited:

Wolverine CAMERA
Airship on some remote runway in the far Canadian north.  Photo copyright B.G. Pearson.

Another reasons I was so delighted by these photos is because one of my favourite painters, Lawren Harris, also spent a lot of time in the Canadian Arctic. I have always felt drawn to his dramatic mountain landscapes capped with snow, and nary a tree for thousands of miles.  The mountains of the far north have a particular shape to them, which seems unique compared to most of the mountains I have seen with my own eyes.

mountThule
Mount Thule, Bylot Island, by Lawren Harris, one of my favourite painters.  He had a very unique view of the same Arctic landscapes my Grandpa used to fly over.

I made it as far north as Lofoten in Norway (68°N), and have flown over parts of the Arctic on transatlantic summer flights, but have never actually set foot on those rugged and remote hills.  Something for my bucket list!

sentinelAlexandraBay
One more of Alexandra Fjord from space, because I can’t get enough of the staggering beauty of these landscapes.  [Source: Sentinel 2 L1C on July 17, 2019]

Coastally Curious and in Quarantine

Greetings from Delft on Day 10 of quarantine!  These are strange times indeed, on so many levels.  I am fortunately still safe and healthy at home in Delft.  Let’s all keep our hands washed and fingers crossed in the weeks to come, and STAY THE FRIG HOME! We’re all in this together.

I have in part been occupying myself with preparing online lectures for our Coastal Dynamics course. We are extremely fortunate in that most of the course was already available online due to preparations made in previous years, but the lectures I was meant to give this week on tidal inlets were not. I changed a bunch of things in the slides last year, so we had a number of student requests to record new lectures. We live in an era where online education was already becoming more and more the norm, and I think this crisis will just push that trend over the edge.

With that in mind, I decided to try my hand at narrating the slides using Kaltura, a program for doing video capture. There are a few different options out there, but that was the one that I liked best. I have actually been having a lot of fun with the lectures- it feels like I’m hosting a podcast or on the radio. “GOOOOOOOOOOOOOOOOOOOOOOOOOOOOOOD MORNING QUARANTINE!!!!!” I suspect it wouldn’t be the most popular podcast (there are not so many of us ebb-tidal delta enthusiasts), but hopefully I can convert a few of our students in the process.

On Friday I prepared a lecture on the evolution of barrier coasts, such as the Dutch coast or much of the Eastern and Gulf of Mexico coasts of the US. I couldn’t help but share a few interesting links with the students, and I thought I’d post them here too. This is a really cool animation showing 30 years of barrier island and tidal inlet evolution on the southeastern coast of Australia, obtained via satellite imagery:

There’s also the iCoast tool developed by the US Geological Survey for training their machine learning algorithms to recognize storm damage to barrier islands from hurricanes.  It shows you to see before and after photos, and asks you to tag the changes or damage that you see, which is a great way to learn more about coastal geomorphology.  You’re also helping the USGS improve their detection algorithms- citizen science!:
https://coastal.er.usgs.gov/icoast/

And here’s another cool interactive site about barrier islands that just popped up yesterday in my twitter feed:
https://wim.usgs.gov/geonarrative/ficc/

To keep myself sane/busy this weekend, I bought a linocut printing kit from the printing shop around the corner from my house (Indrukwekkend, which means “impressive” in Dutch- I love puns that work in more than one language!).  I had always wanted to try it out, but never made time for it.  No time like the present!    I took one of my old sketches of waves (see here for the original inspiration) and made a print of it.  By the end my desk was an unholy mess of ink, but I had a lot of fun and found the linoleum carving to be very therapeutic.  See the top of the page for the finished product!

10-linocut1

That’s all for now. Stay sane and healthy, readers!  And be kind to one another.

Do You Know the Way to San Jose? This Sediment Does…

What pathways does sediment take as it travels through an estuary?  Yesterday, Laurie van Gijzen defended her thesis, entitled “Sediment Pathways and Connectivity in San Francisco South Bay“. Laurie is one of the master’s students that I supervise, and she has done a great job on this project.

San Francisco Bay is a massive estuary, with over six million people living nearby.  In addition to San Francisco, Silicon Valley sits on its shores.  Some of the biggest tech companies in the world like Google and Facebook have their head offices right next to the Bay.  For over 150 years, the ecological health of the bay has deteriorated, in part due to land reclamations and contaminated sediment from gold mining. The dynamics of San Francisco thus have a huge economic, social, and environmental impact.

Laurie’s work focused on calibrating and improving a sediment transport model of the bay, in order to track the pathways of fine sediment (i.e., mud).  She worked with a notoriously fickle model (DELWAQ) and succeeded in greatly improving its calibration.

laurieSummary
Laurie’s thesis summarized into a single diagram (Figure 6.1 from her report).  She shows the dominant sediment pathways as dark arrows, and the net accumulation (import, in orange) or depletion (export, in blue).  Also indicated are the dominant physical processes responsible for sediment transport in the different parts of the bay.  The baroclinic processes mentioned here are currents resulting from density differences in seawater due to changes in salinity and temperature.

Another cool thing about her work is that Laurie was the first person to apply the coastal sediment connectivity framework that I have been developing!  She was able to use this to identify key transport pathways and critical locations in the bay. It was extremely helpful for my research, as it gives us a proof of concept that our framework is applicable to multiple sites and can tell us something useful.

Her work was also accepted for a presentation at the NCK Days conference, which was meant to be held this week in Den Helder, but was cancelled due to ongoing societal chaos. Great job, Laurie!

Sand: Clatsop Beach, Oregon

Today’s sand sample is from Clatsop Beach, Oregon, on the Pacific Northwest coast of the US.  Last summer I spent several months modelling sediment transport at the mouth of the Columbia River with the US Geological survey, and had the great privilege of making a site visit at the end of my stay.

Working in partnership with Oregon State University and the Washington State Department of Ecology, I assisted with a topographic survey of the beaches surrounding the Columbia.  Half the team surveyed the submerged parts of the beaches via jetski, and my group walked transects across the beach and up the dunes using backpack-mounted GPS units.

Starting at far-too-early-in-the-morning, our team split off individually, and I had an entire kilometers-long stretch of the beach to myself until almost lunch time, when we reconvened.  I love long walks on the beach and take great pleasure in that sort of solitude in nature, and it was even cooler to do that while collecting data that could help the project I was working on.  The digital computer model I had worked on all summer was now suddenly a real place where I could feel the sand between my toes.

Gold in Them Hills

The sand at this beach is interesting because of the black grains we see scattered throughout.  This sediment is made of minerals like chromite, magnetite, and garnet, which are heavier than the whitish quartz grains we see around them.  These deposits, known as “placers”, were transported to the sea from the mountains inland by the Columbia River. They form on the beach because lighter minerals like quartz are preferentially sifted out by waves and currents, leaving more of the dense particles behind.   This even includes trace amounts of gold!  Can you see any in the photograph below?

ClatsopBeachOR_000001
Sediment sample from Clatsop Beach, OR.  Note the black “placer” deposits of heavy minerals.  Can you see any flecks of gold?

At the end of our survey, I walked along the beach to check out a surprising object emerging from the sand: the wreck of the Peter Iredale, a sailing ship that ran aground there in 1906:

petereyerdale
The Wreck of the Peter Iredale on Clatsop Beach.

Known as the “Graveyard of the Pacific“, the mouth of the Columbia is truly a “killer ebb-tidal delta”: huge waves and powerful currents meet violently, and have caused dozens of shipwrecks over the past few centuries.  This makes effective management of the sediment there crucial for safe navigation, keeping the shipping channel dredged clear and disposing of the sediment in environmentally-friendly, cost-effective, and useful ways.

wrecks
Historical shipwrecks at the Mouth of the Columbia River, seen in the Columbia River Maritime Museum.  

Strategic placement of this dredged sediment was the focus of my time at USGS last summer, but I will delve into that more in a future post!

Sand: UBC Cliffs/Wreck Beach

Vancouver holds a special place in my heart.  I was born out there, and even though we moved away when I was very young, it has continued to re-emerge in my life.  In 2011, I moved out there after a difficult breakup and the city breathed new life back into me.  While there, I discovered a new vocation in hydraulic modelling for predicting floods, something that I am still doing to this day.  I have returned to Vancouver a number of times since then, since my brother and a surprising number of my closest friends have ended up out there.  I hope to return this September for a wedding!

vancouver
Coal Harbour, Vancouver.

One of my favourite parts of Vancouver is walking its coastline.  The city was built on the edge of a large fjord, but has a variety of coastal landscapes, from towering cliffs to sandy beaches, mud flats to salt marshes, and of course a number of urbanized shorelines.

Even though I am in the Netherlands now, I am trying to keep my Vancouver connection alive through my work.  Last year, I co-supervised a fantastic group of TU Delft students who worked with Kerr Wood Leidal and the University of British Columbia (UBC) to investigate the erosion of the Point Grey cliffs, on which UBC is situated.

wreckbeach3
Eroding cliffs of Point Grey.  The University of British Columbia is at the top of the cliff, so naturally they are concerned with understanding the rate of erosion and means of slowing it.

The project was an interesting one, as the students (representing three different countries) tried to bring their lessons learned about Dutch coastal engineering to Canada.  Canadian coastal zone management is much more fragmented than in the Netherlands, where everything is more or less centrally controlled by the federal government.  The entire Dutch coastline is also incredibly well-monitored, with high resolution bathymetry taken every few years, and with countless other measurements available.  Acquiring the data necessary to perform a coastal engineering study in Vancouver required contacting dozens of different sources and dealing with numerous agencies at multiple levels of government.

UBCcliffs_000012
Sand from Wreck Beach.  It is quite coarse and angular in shape, and the green and red tints are quite nice. Being glacial in origin, these sand grains have likely been bulldozed by ice or carried by meltwater from far and wide.  This accounts for the variety of particles we see.

In the end, the students looked at a number of possible solutions for slowing the coastal retreat, including sand nourishments and revetments.  One of the most intriguing concepts that they explored was the idea of a clam garden, a traditional approach from the First Nations people living on the BC coastline.   Originally intended for aquaculture, clam gardens are usually small rock walls placed along gravel beaches, behind which where clam-friendly sand or mud can accumulate.  However, this approach could have added benefits for coastal protection by attenuating waves and encouraging the deposition of sediment.  In many ways, it is not that different from the Dutch using brushwood dams to reclaim land in the Netherlands or my colleagues using similar structures to rebuild mangrove habitats.

In Canada, the involvement of First Nations in coastal planning is becoming increasingly important (as I think it should be!), and there is a lot that science and engineering can benefit from their traditional forms of knowledge and experience.  Building with nature instead of fighting against it has recently become a popular design philosophy in coastal engineering, and who better to have as allies in that task than the people who have been living with and building with nature already for centuries?

wreckbeach2
World War II-era bunker on Wreck Beach overlooking the Georgia Strait, with North Vancouver in the background.


The Delft-Vancouver connection continues: right now we have a group of five students investigating coastal protection solutions with Kerr Wood Leidal and the Tsleil-Waututh Nation.  They have already been out there for a month, and I am excited to see what they come up with!

spanishBanks
Sunset over the Spanish Banks, just around the corner from UBC.